Help me fake a graph (generate random graphs for spirometry)
September 29, 2020 1:24 PM Subscribe
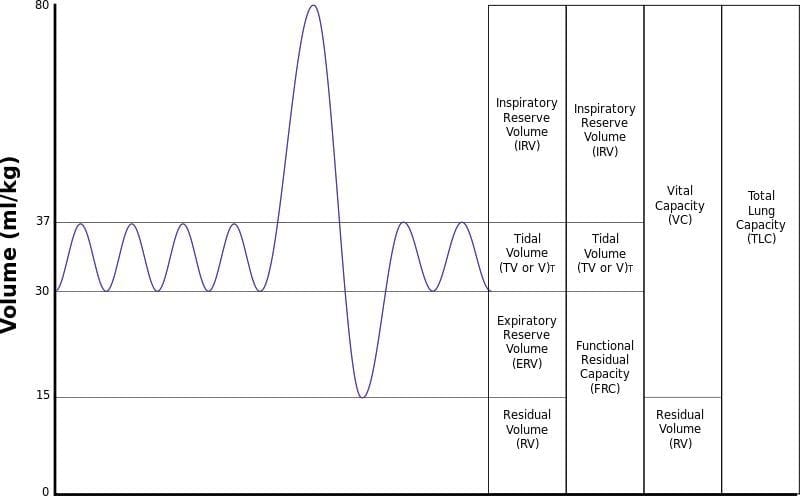
I want to make a graph that looks like a textbook example of a spirograph. I want to be able to set some key values randomly, but keep the shape similar. Is this possible?
If successful, I'll be using this to make some practice problems for students to work through while studying spirometry. It seems like the very basics (calculate Vital Capacity, Find Tidal Volume, what-is-this-number-that's-right-on-the-graph) are the main hurdle, and that once past that point improvement is more rapid.
I want to keep the shape of a graph like this, but randomly set the peaks and valleys (including the peaks and valleys for the tidal volume).
I've played around a bit in desmos, geogebra, and (why not?) excel, and I can't figure out a function that lets me control just those bits.
This absolutely has to be a solved problem (or else what kind of fishy business has Fourier analysis been up to all this time?), but I'm just not getting there.
I want to quickly be able to: generate a random max and min for amplitude, and a random max and min for the smaller (tidal) amplitude.
I am TOTALLY fine if the solution is: generate 4 values in given ranges and smoothly curve lines to match them. Or some other thing that looks enough like the example graph no matter how weirdly it's built.
In the amount of time I've spent on this, I could have just drawn a bunch of graphs by hand, but now I've got it stuck in my mind and I want to see if it can happen.
relevant xkcd
Best answer: You might find this calculator at Desmos handy. It's maybe not exactly perfect, but it's a start.
posted by baltimoretim at 2:00 PM on September 29, 2020 [1 favorite]
posted by baltimoretim at 2:00 PM on September 29, 2020 [1 favorite]
Best answer: Here's an approximation to play with. The idea is to notice that e^(-x^2) has a maximum value of 1 and drops off toward 0 symmetrically and relatively quickly, and then use scaled versions of this function to exaggerate two peaks of a sine wave.
Consider the function 1+5*sin(pi*x/2)*(2*e^(-(2*(x-1))^2)+1)*(0.5*e^(-(2*(x-3))^2)+1) (link goes to Wolfram Alpha plot). This starts with the shifted sine function 1+5*sin(pi*x/2). That tells you that your tidal volume is going between 1-5=-4 and 1+5 = 6. Then we multiply by a couple of bump functions. The first bump function is centered at 1 and the second bump function is centered at 3. The first bump function multiples everything by at most 2+1=3, so that puts the greatest maximum at 1+3*5 = 16. The second bump function multiplies everything by at most 0.5+1=1.5, so that puts our most impressive minimum at 1-5*1.5 = -6.5.
posted by yarntheory at 5:13 PM on September 29, 2020
Best answer: It's a total hack but think I got pretty close: glitch
posted by mpark at 11:26 AM on September 30, 2020
posted by mpark at 11:26 AM on September 30, 2020
Response by poster: Thanks! I used a bit of everything to make a slightly different "total hack" that works well enough.
Actually a bunch of these would have worked well enough without any further tweaking, but where's the fun in that?
I even made notes so I'll remember how to use it every year or so. Unbelievable.
posted by Acari at 6:57 PM on October 9, 2020
Actually a bunch of these would have worked well enough without any further tweaking, but where's the fun in that?
I even made notes so I'll remember how to use it every year or so. Unbelievable.
posted by Acari at 6:57 PM on October 9, 2020
This thread is closed to new comments.
To graph look to rework the equation into a parametric form, set values and graph incrementing t.
posted by sammyo at 1:49 PM on September 29, 2020