How to dumb down a complex scenario graphically for my boss?
December 6, 2007 7:26 PM Subscribe
How do I represent multiple 'dimensions' or part of a decision tree for an executive readout? Gotta get this on one/two PPT slides!
Here's the deal: I have to show how each of our seven (similar) products will appeal to different customer groups. Generally the five customer dimensions are: Size, infrastructure, Requirement C, Requirement D, etc. Assume that each dimension is binary - has 2 possible values.
For each product, it will appeal to one or both of the dimension attributes (Product A may appeal to both small and large customers, for example, but only those with an wireless infrastructure, not with an Ethernet infrastructure... and so on).
Now, I can show a big ugly table (or 2) to try to represent how each of the seven products will be suitable for each customer type, but I can see my boss and his boss's eyes glazing over if I did that. So the question is more one of how to make this information consumable by higher-ups.
Any graphic/powerpoint wizards out there???
Thanks, Hive
You've got 7 products but 32 customer groups. It's likely some products are insensitive to quite a few customer dimensions - particularly if some products are niches aimed at very specific sub-groups. So pull out what's unique: if product 1 is only aimed at large, wireless customers with at least 2 of A, B and C, then draw the link explicitly.
Conversely, if product 7 only depends on whether you're big or small, then just draw attention to that.
You only have 7 products so as long as it's clear how you're segmenting the customers, you only have to draw attention to the aspects that matter for that customer.
posted by crocomancer at 4:08 AM on December 7, 2007
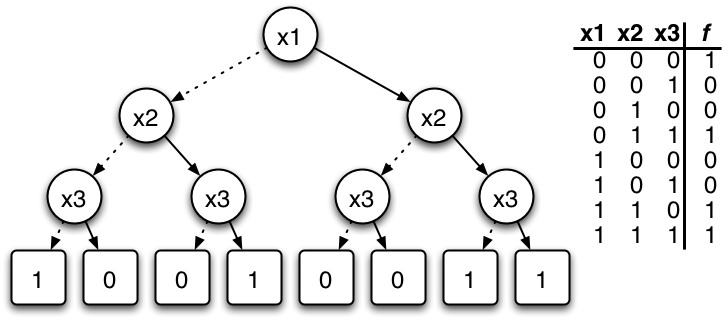
How about a tree of customers with colored end nodes by product? Kinda, vaguely like this but the round nodes are classifying customers and the square nodes are your products.
posted by shothotbot at 6:13 AM on December 7, 2007
posted by shothotbot at 6:13 AM on December 7, 2007
Best answer: I'd show the different variables on a slide...with some explanation of what you're doing.
Then....
...I'd have three example cases and show how they fit into the different categories explicitly. I'd use a Venn Diagram with overlapping circles to show how well they fit (keep in mind, you could make some circles bigger/smaller). I'd totally personalize those examples (a picture of a customer, with a name, etc and a description of who he/she is.)
Then, I'd have the next slide be a summary of the customer types.
The slide after would be the breakdown of EVERYTHING - totally overwhelming on purpose. I'd probably say, "I have this worked out, and if anyone wants me to go through specific types/examples, I'm happy to, after the meeting."
In other words, I'd use direct examples to show the different variables, show some specific examples, but indicate that it's both complex and simple..if you bother to invest the time.
posted by filmgeek at 7:32 AM on December 7, 2007
This Periodic Table of Visualization Methods might be helpful.
posted by bkudria at 10:19 AM on December 7, 2007
posted by bkudria at 10:19 AM on December 7, 2007
Best answer: Have an n X 2 grid with categories on the top & the binary options on the side. For every product, shade in the cells that it is true for. This works well for a single product, but adding extra products will be ugly.
For multiple products, you can try something like this. Have an 2n X 2n grid, with the categories on both sides. In each cell, a dot will show which products support this configuration. The diagonal can be used as a key as to which products have the trait. This is a super ugly mockup. It will take some explaining, but it should give a decent representation of the coverage of different configurations. You could use colored squares inside instead of dots, which could make it easier to see coverage.
posted by devilsbrigade at 10:27 AM on December 7, 2007
« Older War, what is it good for? About four hours viewing... | Paying for the crimes of others Newer »
This thread is closed to new comments.
I've seen this done before a few times, though it is very hard to do well.
I think the mistake is trying to capture everything on the slide. There's usually nothing wrong with having supporting data/additional info at hand to explain the detail if they're interested or you've missed the mark.
I'm guessing something along these lines:
[[Customer type | Requirement A | Requirement B | Requirement C]]
[[Small customers | Wireless | High | Low | Low]]
[[Small customers | Ethernet | High | High | High]]
Where I've added "High", "Low" etc, I've seen this better represented as a tiny pie chart (not a real one, just a representative graphic). So if it was awesomely suited for the target group, the pie chart would be full. If it's only ok, the pie would be half full, if it sucked, it might be just an outline or a quarter. Just colour in the four parts of the circle/pie as appropriate. Makes it a bit more visually compelling and easier to quickly see where the best options are - i.e. more pies!
posted by kaydo at 11:52 PM on December 6, 2007