Mathematically favouring sports underdogs
June 20, 2018 4:38 PM Subscribe
A coworker told me that he doesn't enjoy watching basketball because the high scores give less opportunity for surprising victories, as the scores are a reasonably good statistical reflection of which team played better in a given game. The low scores of soccer lead to the opposite problem for someone who likes surprising victories, since ties are so common. He came to the fine Canadian conclusion that hockey is just right. I suspect that he is mathematically correct, but I'm not sure which mathematical or statistical tools would help me prove or disprove it. Are there laws of small numbers that would apply to this analysis?
Let's say that I want to figure out how often the worse team wins if the better team would've scored an average of 20% more points if the game had been replayed a few thousand times.
For basketball, I'm guessing that I could put my means 20% apart, pick a standard deviation, and run a bunch of simulations using a Gaussian distribution. I wouldn't be surprised to learn that there's an analytical solution which wouldn't even require me to simulate in order to get a reasonably accurate result.
But what would be the equivalent for soccer or hockey, with their much lower scores?
Analysis from 2016. The NHL is indeed the most 'fair', with MLB and the NFL in close competition.
A few years back I did some pretty extensive studying on the NFL since the company I worked for was a sponsor. One of the neatest results of the NFL having a very firm salary cap is that once a player gets 'too good' they have to be traded or the team has to get worse supporting players (assuming salary is correlated to quality of players). With the exception of legacy players, like Tom Brady (who sandbags his salary so that other players can be competitive), this works to create incredibly balanced teams with a higher degree of volatility in year over year performance and match-ups. This is not to say that Cleveland Browns fans can soon hope to see their superbowl ring, but it is saying that the Cleveland Browns will still give the best team in the league a good game and have the potential for an upset victory.
To see that the NHL actually scores higher in this manner, I don't think of as a big surprise... The length of the season, the physicality of the play, the quickly changing lines, the routine partial season play, the constant during-season trading, and a salary structure which prevents a lot of great players - make the NHL an excellent league for parity.
posted by Nanukthedog at 6:12 PM on June 20, 2018 [3 favorites]
I don't think this can be analytically solved in any meaningful sense, it's like trying to calculate which is bigger, fruit or rodents.
I think dfan is right in terms of simulation, Poisson is not a bad way of simulating this. If we use this to simulate scoring, the answer is mathematically determinate that if the better team is x% more likely to score, then the greater the expected number of scoring events, the more frequently the better team wins.
Note that it's scoring events, not scores -- a football game often has a score like 24-10 (the most common winning and losing score respectively) but this is really one team scoring three touchdowns and a field goal and the other team scoring a touchdown and a field goal, basically the same as a 4-2 hockey or baseball game. The same applies to basketball with most points coming from 2 and 3 point shots. This isn't perfect - some teams make higher scores more frequently and there is also strategy - but it's better than assuming that the average football game has double digit scoring events.
Using this, the most determinate sport is basketball - a little under 50 scoring events per game for the average team, followed by baseball at around 4.5, with the NFL and NHL around 2.7 scoring events per team per game. Soccer is lower still; MLS is around 1.6 and the big European leagues closer to 1.4. I suspect in practice, hockey is less determinate than football given the same scores because field position changes much more slowly in football -- if with three minutes left the score is tied and the home football team has the ball at the opposition's 20 yard line, that's much more meaningful than the home hockey team having the puck in the other team's end -- within 10 seconds, the odds are that the puck will be somewhere completely different in the rink.
But all of this is sort of abstract, because it's making the assumption that the better team is arbitrarily x% more likely to score -- from this assumption, the results are straightforward. In the real world, things are way more complex. One example is the distribution of talent in the league -- the analysis Nanukthedog links to is really about that; note that English soccer is more equitable than Spanish soccer, and I'm certain that the MLS would be more equitable than English soccer, even though they are all playing the same sport. This affects whether a game between a pair of teams is likely to have the better team be 5% more likely to score, or 25%.
This is primarily due to the underlying structure of the league (such as salary caps) more than the sport itself. If you took a sports league, threw out the 50 best players (the difference between Lebron James and the 10th best player is much bigger than the difference between #50 and #60) and had each team draft a new lineup picking in order like most drafts, you would probably wind up with a very equitable league. If instead, you randomly chose one team to draft an entire lineup of the best players available, then the next team to pick their entire lineup from the remainders, and so on until the last team had the worst players, it would be completely inequitable and the results highly deterministic -- even though it's the same sport and same players!
Another complexity is native to the sport itself; Lebron James can play (ie is out on the field) 85% or more of a game, Cristiano Ronaldo usually plays 100%, while Tom Brady only plays around 50% of the time and Alex Ovechkin plays around 30-35%. Baseball is more complicated - a good batter has about 1/9 of the bats, but a good fielder plays 100%; a good starting pitcher might pitch a majority of the game, but only every third or fourth game.
This video looks at how much of the result of a league season is due to luck and how much due to skill doing some calculations on the variance; it concludes that the NBA is the most skill based, followed by Premier League, MLB and NFL in the middle in that order and the NHL the most luck based. But this is not correct for a random game, rather an entire season, and "skill" is everything deterministic, like the distribution of talent. This is complicated by things like league structure -- there are more baseball games in a season than football games (and NFL seasons are structured so that the teams that did better in the previous season meet so they have harder schedules).
This paper draws out more details and uses betting data to look on a per-game basis. They conclude that MLB and NHL are similar and more random; the NBA and NFL are similar and less random. (Figure 7 is the most useful.)
In general, every way you slice it the NBA is the least random league and the NHL the most random; in general baseball is more random than football. Soccer depends most on the context; between spherical teams that are arbitrarily better or worse, the scores tend to be more random, but in the real world in most cases (the MLS is the biggest exception) the talent is so lopsidedly distributed that the leagues themselves are highly deterministic.
posted by Homeboy Trouble at 9:48 PM on June 20, 2018 [6 favorites]
Response by poster: Thanks, dfan! Based on your answer, and the reassuring note in the Wikipedia article about the Poisson distribution that "the average number of goals in a World Cup soccer match is approximately 2.5 and the Poisson model is appropriate", I hacked together a script last night which produced the following results. (Apologies in advance to anyone trying to read this on a small screen.)
If I'm correctly remembering what it all means, and I didn't make any mistakes in my code, a line like this:
Here's the script, if anyone is interested. As you can see, I defaulted to very_verbose_variable_names, hard-coding my parameters, and pfffft-functions-who-needs-'em. (For anyone thinking of hiring me, this is not the state in which I'd leave production code.)
Once my morning brain fog wears off, I'll read the other answers more closely.
posted by clawsoon at 3:24 AM on June 21, 2018 [1 favorite]
OVERdog     Best       Range of underdog       Range of OVERdog    Average of underdog
advantage   underdog   average scores which    average scores for  winning scores for
            win %      gives within 10% of     previous column     average scores in
                       best underdog win %                         previous columns
1.10        38.9%      1.6-22.8                1.8-25.1            2.6-26.5
1.15        36.1%      1.3-13.0                1.5-14.9            2.3-15.8
1.20        34.4%      1.1-8.0                 1.3-9.6             2.1-10.3
1.25        32.2%      0.9-6.6                 1.1-8.2             1.8-8.8
1.30        31.2%      0.9-5.0                 1.2-6.5             1.9-6.9
1.35        29.8%      0.9-4.1                 1.2-5.5             1.9-5.9
1.40        28.1%      0.8-4.2                 1.1-5.9             1.8-6.1
1.45        27.0%      0.8-3.2                 1.2-4.6             1.8-4.9
1.50        25.8%      0.7-3.3                 1.0-4.9             1.7-5.1
1.55        25.2%      0.6-2.3                 0.9-3.6             1.5-3.8
1.60        24.6%      0.6-2.1                 1.0-3.4             1.5-3.5
1.65        23.6%      0.6-1.9                 1.0-3.1             1.5-3.3
1.70        22.7%      0.5-1.8                 0.8-3.1             1.4-3.2
1.75        21.4%      0.5-2.0                 0.9-3.5             1.5-3.6
1.80        21.3%      0.5-1.5                 0.9-2.7             1.4-2.8
1.85        20.7%      0.5-1.7                 0.9-3.1             1.4-3.1
1.90        20.3%      0.5-1.4                 0.9-2.7             1.5-2.7
1.95        19.7%      0.5-1.3                 1.0-2.5             1.5-2.6
2.00        18.9%      0.5-1.3                 1.0-2.6             1.5-2.6
...
2.50        14.9%      0.3-1.0                 0.8-2.5             1.3-2.3
...
3.00        12.2%      0.2-0.7                 0.6-2.1             1.2-1.9
...
3.50        10.8%      0.3-0.5                 1.1-1.8             1.3-1.6
...
4.00         9.4%      0.2-0.4                 0.8-1.6             1.2-1.5
...
4.50         8.3%      0.2-0.4                 0.9-1.8             1.2-1.5
...
5.00         7.3%      0.2-0.3                 1.0-1.5             1.2-1.4
I swear that it all made sense when I wrote it, but my foggy morning brain is now less than sure. I should really plug the full results, not just these top-10% results, into matplotlib.If I'm correctly remembering what it all means, and I didn't make any mistakes in my code, a line like this:
1.50 25.8% 0.7-3.3 1.0-4.9 1.7-5.1...means that the overdog would score an average of 50% more goals than the underdog had the game been replayed 10,000 times. In that situation, the underdog could win at least 25.8%*0.9=23.2% of the time if they were playing the sort of game where their average score was between 0.7 and 3.3, and the overdog's average score - being 50% better - was between 1.0 and 4.9. The underdog would be expected to get 1.7 goals in winning efforts in a league where they'd score an average of 0.7 goals in all games against a 50%-better team. The underdog would be expected to get 5.1 goals in winning efforts in a league where they'd score an average of 3.3 goals in all games against a 50% better team.
Here's the script, if anyone is interested. As you can see, I defaulted to very_verbose_variable_names, hard-coding my parameters, and pfffft-functions-who-needs-'em. (For anyone thinking of hiring me, this is not the state in which I'd leave production code.)
#!/usr/bin/python2.7

from numpy.random import poisson
from collections import Counter

def top_ten_percent(counter):
    top = counter.most_common(1)[0]
    near_top = [x[0] for x in counter.most_common() if x[1] > top[1] * 0.9]
    return min(near_top), max(near_top)

if __name__ == '__main__':

    rounds = 10000

    print 'OVERdog     Best       Range of underdog       Range of OVERdog    Average of underdog'
    print 'advantage   underdog   average scores which    average scores for  winning scores for'
    print '            win %      gives within 10% of     previous column     average scores in'
    print '                       best underdog win %                         previous columns'

    for advantage in range(110, 505, 5):
        overdog_advantage = advantage / 100.0
        underdog_wins = Counter()
        underdog_winning_scores = Counter()
        for average in range(10, 2550, 10):
            underdog_average = average / 100.0
            for i in range(rounds):
                overdog_average = underdog_average * overdog_advantage
                underdog_score = poisson(underdog_average)
                overdog_score = poisson(overdog_average)
                if underdog_score > overdog_score:
                    underdog_wins[underdog_average] += 1
                    underdog_winning_scores[underdog_average] += underdog_score
        best_win_pct = 100.0 * (underdog_wins.most_common(1)[0][1]) / rounds
        min_near_top, max_near_top = top_ten_percent(underdog_wins)
        near_top_range = '%s-%s' % (min_near_top, max_near_top)
        overdog_range = '%.1f-%.1f' % (min_near_top * overdog_advantage, max_near_top * overdog_advantage)
        avg_winning_score_min_near_top = float(underdog_winning_scores[min_near_top]) / underdog_wins[min_near_top]
        avg_winning_score_max_near_top = float(underdog_winning_scores[max_near_top]) / underdog_wins[max_near_top]
        avg_winning_score_range = '%.1f-%.1f' % (avg_winning_score_min_near_top, avg_winning_score_max_near_top)
        print '{:.2f}{:>12.1f}%      {:<24}{:<20}{}'.format(overdog_advantage, best_win_pct, near_top_range, overdog_range, avg_winning_score_range)
Hopefully I got all of the > < to > < conversions, and the procedure itself, correct.Once my morning brain fog wears off, I'll read the other answers more closely.
posted by clawsoon at 3:24 AM on June 21, 2018 [1 favorite]
Response by poster: Nanukthedog: Clever use of the Gini coefficient. Nice!
Homeboy Trouble: I'm definitely interested in spherical teams. I'm still reading the paper, but it looks like it'll do a good job of comparing spherical teams to real teams.
posted by clawsoon at 4:01 AM on June 21, 2018
Homeboy Trouble: I'm definitely interested in spherical teams. I'm still reading the paper, but it looks like it'll do a good job of comparing spherical teams to real teams.
posted by clawsoon at 4:01 AM on June 21, 2018
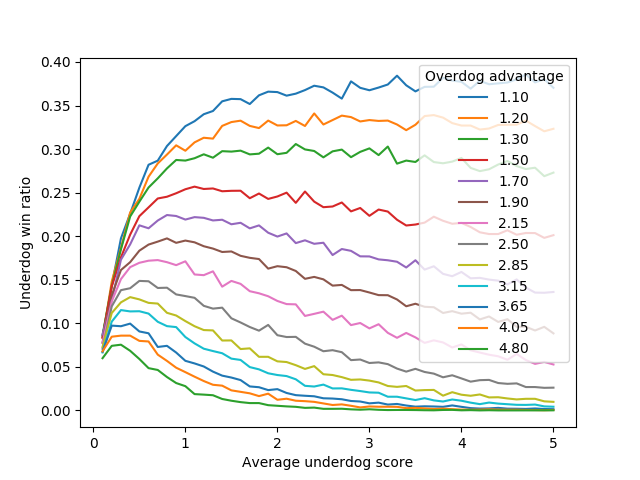
Response by poster: Graphs of the data I generated:
By underdog average score, zoomed in.
By underdog average score, zoomed out.
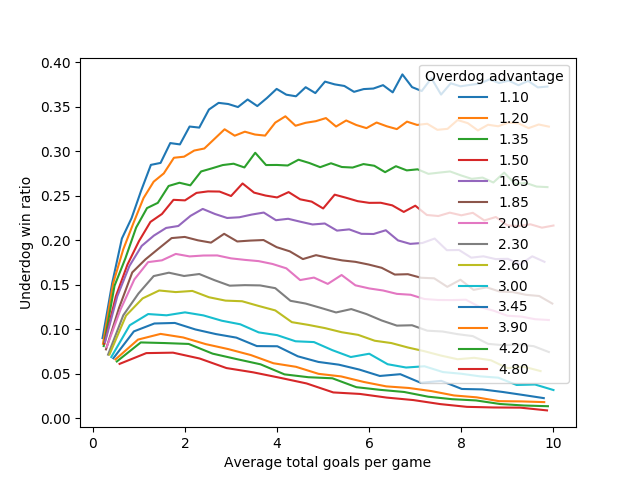
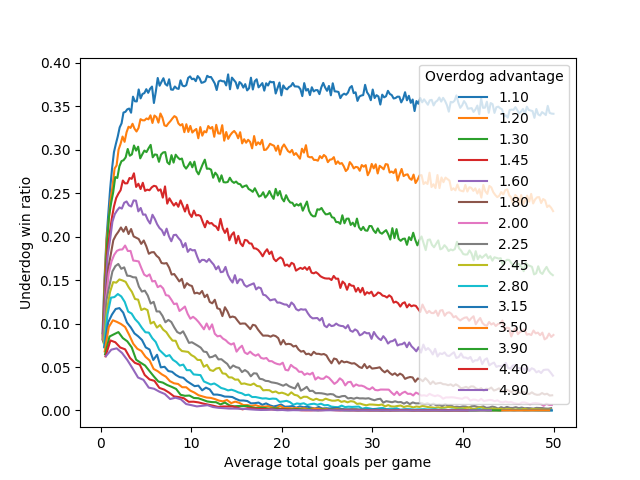
By average total score, zoomed in.
By average total score, zoomed out (a little noisier since I'm late for work and could only run 1000 rounds each).
Short version: If you have a league where the best teams are twice as good as the worst teams (by number of goals scored), and you want the worst teams to beat the best teams as often as possible - not just tie, but beat - you'll want your games to have an average total score between 1.5 and 4 goals. If you do that, the worst teams will beat the best teams once every 5 or 6 games.
If your total game scores are above 45, the half-as-good team will win less than 1% of the time.
posted by clawsoon at 7:32 AM on June 21, 2018 [1 favorite]
By underdog average score, zoomed in.
By underdog average score, zoomed out.
By average total score, zoomed in.
By average total score, zoomed out (a little noisier since I'm late for work and could only run 1000 rounds each).
Short version: If you have a league where the best teams are twice as good as the worst teams (by number of goals scored), and you want the worst teams to beat the best teams as often as possible - not just tie, but beat - you'll want your games to have an average total score between 1.5 and 4 goals. If you do that, the worst teams will beat the best teams once every 5 or 6 games.
If your total game scores are above 45, the half-as-good team will win less than 1% of the time.
posted by clawsoon at 7:32 AM on June 21, 2018 [1 favorite]
It's a bit mathy, but I really enjoy this economics article about 'surprise vs. suspense'
http://faculty.chicagobooth.edu/emir.kamenica/documents/suspense.pdf
Here is their chart of the amount of surprise and suspense in several sports:
Chart
Here is the money quote:
"While no existing sport would induce the exact distributions of belief
paths we derive, we can think of soccer and basketball as representing
extreme examples of sports with the qualitative features of optimum suspense
and surprise. In any given minute of a soccer game, it is very likely
that nothing consequential happens. Whichever team is currently ahead
becomes slightly more likely to win since less time remains. There is a
small chance that a team scores a goal, however, which would have a
huge impact on beliefs. So as fig. 3 illustrates, belief paths in soccer are
smooth, with few rare jumps. This sustained small probability of large
belief shifts makes soccer a very suspenseful game. In basketball, points
are scored every minute. With every possession, a team becomes slightly
more likely to win if it scores and slightly less likely to win if it does not.
But no single possession can have a very large impact on beliefs, at least
not until the final minutes of the game. Belief paths are spiky, with a high
frequency of small jumps up and down; basketball is a game with lots of
surprise"
posted by vegetableagony at 12:50 PM on June 26, 2018 [3 favorites]
This thread is closed to new comments.
posted by dfan at 5:11 PM on June 20, 2018 [8 favorites]