Monitoring Disk Space on a Headless Linux Server
January 19, 2019 3:35 PM Subscribe
I'm looking for advice on how to monitor the available space/visualise space used on the drives of a headless Linux (Ubuntu) server from a Windows 10 Desktop.
The server (currently running Ubuntu 18.04) has several large-ish disks and I'd like to be able to monitor hard drive space/usage from my Windows 10 desktop machine - ideally on the desktop itself.
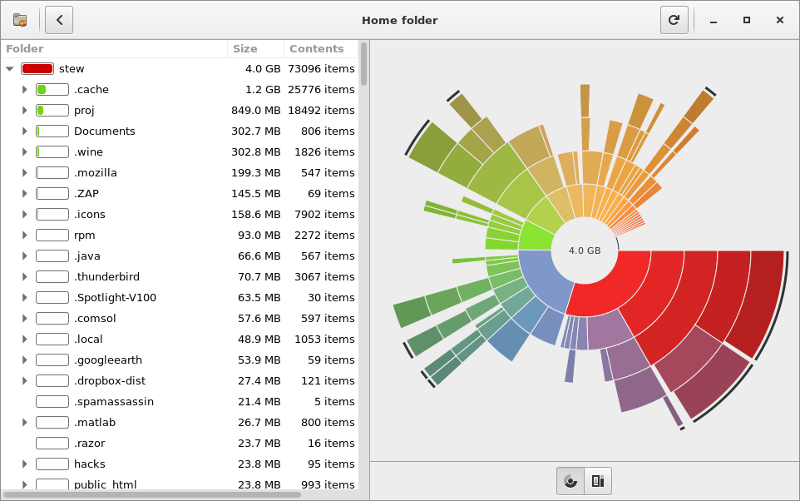
A little investigation has led me to the software package duc (previously known as philesight), which does almost what I want - specifically, it creates "sunburst" diagrams as image files, which I can then view on my Desktop (or possibly as Live Tiles in the start menu). However, the problem with duc output graphs is that they only track the composition of the data that is on the disk/filesystem specified - i.e. 100% is all the data on the disk, not the total disk size, and hence the data is always shown as a closed circle. This means that the disk always "appears" to be full - if you have 2TB of data on a 4TB HDD, the duc graphic will show a complete circle that represents 2TB, not a semi-circle showing 2TB of space and 2TB of data.
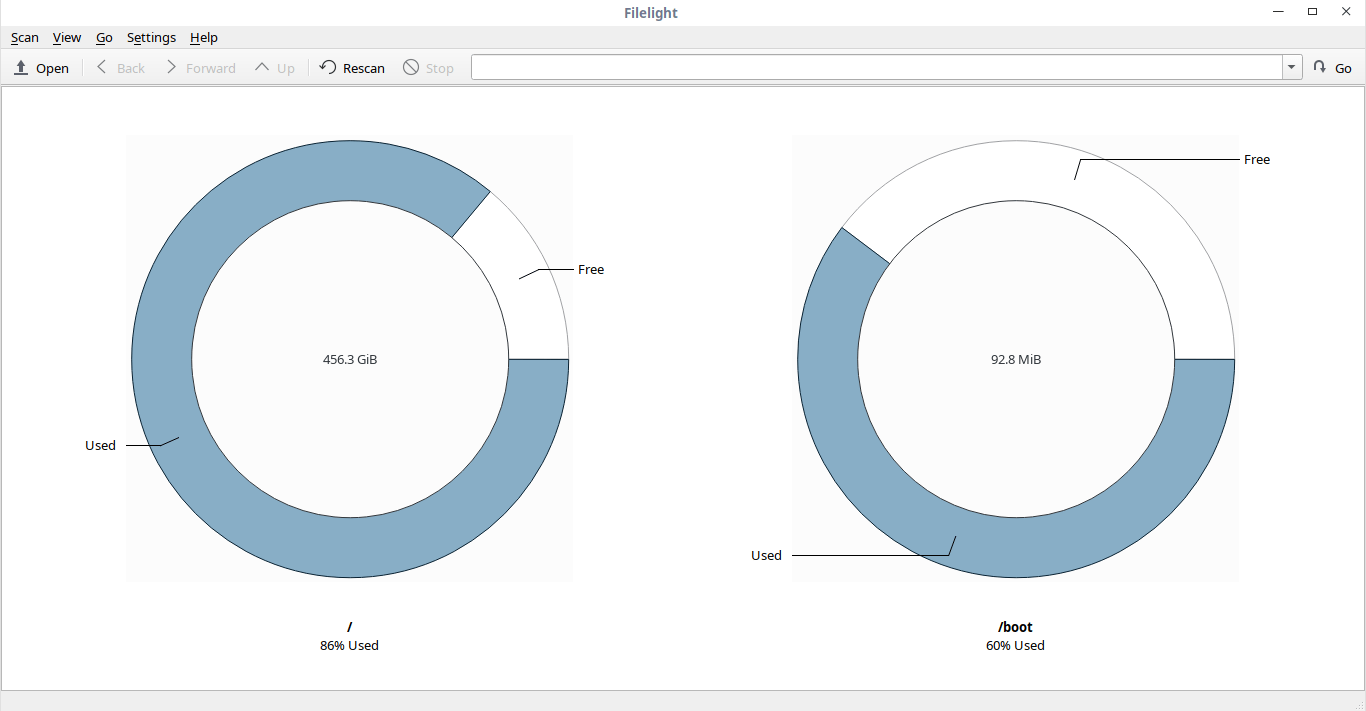
I've looked through the man and a few tutorials for duc, and I can't find an option to assess the whole drive, and hence leave a gap in the ring to represent the empty space. There are other software programs which will show a diagram in the format that I want, but most of the Linux based ones that do are designed to be used interactively (e.g. Baobab/Disk Space Analyzer, Filelight, etc), and on a headless server, that's not really an option.
My ideal solution would be a software program/package that runs on the server (i.e. Linux) on a script/schedule and outputs image files for a range of HDDs, which would then be visible on the Windows Desktop either via a webpage or SMB share that the Desktop would use. That said, I am willing to consider different constructs if people have ideas. Ones that minimize requirements to log into the server before starting would be useful, I'm trying to streamline the process here.
Any ideas?
The server (currently running Ubuntu 18.04) has several large-ish disks and I'd like to be able to monitor hard drive space/usage from my Windows 10 desktop machine - ideally on the desktop itself.
A little investigation has led me to the software package duc (previously known as philesight), which does almost what I want - specifically, it creates "sunburst" diagrams as image files, which I can then view on my Desktop (or possibly as Live Tiles in the start menu). However, the problem with duc output graphs is that they only track the composition of the data that is on the disk/filesystem specified - i.e. 100% is all the data on the disk, not the total disk size, and hence the data is always shown as a closed circle. This means that the disk always "appears" to be full - if you have 2TB of data on a 4TB HDD, the duc graphic will show a complete circle that represents 2TB, not a semi-circle showing 2TB of space and 2TB of data.
I've looked through the man and a few tutorials for duc, and I can't find an option to assess the whole drive, and hence leave a gap in the ring to represent the empty space. There are other software programs which will show a diagram in the format that I want, but most of the Linux based ones that do are designed to be used interactively (e.g. Baobab/Disk Space Analyzer, Filelight, etc), and on a headless server, that's not really an option.
My ideal solution would be a software program/package that runs on the server (i.e. Linux) on a script/schedule and outputs image files for a range of HDDs, which would then be visible on the Windows Desktop either via a webpage or SMB share that the Desktop would use. That said, I am willing to consider different constructs if people have ideas. Ones that minimize requirements to log into the server before starting would be useful, I'm trying to streamline the process here.
Any ideas?
I run good ol' Munin, one of its default graphs in Ubuntu is disk usage.
A graph like that is only useful if you remember to look at it. You probably would rather have an alert when the disk is near full. I don't have a great answer for how to do that in a modern Ubuntu system.
posted by Nelson at 5:52 PM on January 19, 2019 [2 favorites]
A graph like that is only useful if you remember to look at it. You probably would rather have an alert when the disk is near full. I don't have a great answer for how to do that in a modern Ubuntu system.
posted by Nelson at 5:52 PM on January 19, 2019 [2 favorites]
Wouldn't loading up Powershell or cmd in Windows 10 and issuing a command like:
ssh username@headlessservername df -h
Give you what you're looking for? That will show all of the disks (or disk partitions) on the headless system, the sizes of those partitions, and both used and available space.
That said, Nelson has an excellent point that checking stats or images is only as good as one's remembering to run those checks. The general Linux way of monitoring health on a headless server would be to run the Nagios or Shinken monitoring platforms on the headless server, and setting them to email you when the disk space used exceeds a percentage or amount used of the available disk. Lots of Nagios plugins to do that for you...
posted by eschatfische at 7:13 PM on January 19, 2019 [2 favorites]
df | grep "/dev/vda1 " | awk '{print $4}'
Will get you the size of free space in kilobytes. You can use this in an if command:
if [ `df | grep "/dev/vda1 " | awk '{print $4}'` -lt 1000000 ]; then
echo "whoa, running out of space ";
fi
And if you use something like Slack, you can insert the curl command for an incoming webhook instead of the echo command.
posted by suedehead at 7:21 PM on January 19, 2019 [1 favorite]
One option would be Cockpit, which is a web-based interface for managing servers. You can see storage usage as a bar graph of the available space on a partition. You would just log into Cockpit itself via your browser.
Here's what the storage view looks like. Note that if you're on an Ubuntu system you'll need to install not only Cockpit but also the cockpit-storaged package.
Here's what you'd do from the terminal:
sudo apt install cockpit cockpit-ws cockpit-storaged
Then
sudo systemctl start cockpit.service
Then pull up the web page, https://[insert system IP address]:9090
The SSL certificate will probably prompt a warning, go ahead and accept the self-generated certificate.
posted by jzb at 7:23 PM on January 19, 2019 [1 favorite]
There's immensely complex solutions to this, but on the simple end this is almost made for MRTG. It's built to store historical data and then output images and a web page that the images fit into. It was originally made for network traffic graphs but there are disk solutions out there.
If you are really bored and want immensely complex solutions then Prometheus and Grafana are a good pairing.
posted by How much is that froggie in the window at 12:19 AM on January 20, 2019 [2 favorites]
If you are really bored and want immensely complex solutions then Prometheus and Grafana are a good pairing.
posted by How much is that froggie in the window at 12:19 AM on January 20, 2019 [2 favorites]
You could use Cacti for this purpose, although it might be overkill. Also, Cacti is not trivial to set up. You'd want to find a Linux guru to install & configure it for you. However, after it's configured, you won't really have to do anything but check the application's web GUI to get the stats you need.
posted by alex1965 at 9:10 AM on January 22, 2019
posted by alex1965 at 9:10 AM on January 22, 2019
Seconding jzb on Cockpit. You could also use Webmin, but that can be a little heavier on the load. Plus is actually lets you manage/update/run/install/reboot/etc the server. I use it for pretty much every linux headless server I manage (for now, until I get my next stage up and running).
posted by daq at 4:27 PM on January 22, 2019
posted by daq at 4:27 PM on January 22, 2019
If you're exporting (part of) the filesystem in question to Windows using Samba, you can use the normal Windows tools to view free/used disk space.
posted by wierdo at 1:54 PM on January 23, 2019
posted by wierdo at 1:54 PM on January 23, 2019
Response by poster: Thanks for all the answers, some good options here I hadn't considered. I took a look at a few but in the end, I decided to roll my own solution - the Ubuntu system in question is a home server, and this isn't a work environment - something I thought I'd put in the original question but upon re-reading I realised I'd missed out.
Briefly, I used a script on the server to run Duc to generate the sunburst graph, and du to track available and used space. The script generates a used/available bar as an image using du output and appends it to the sunburst image, placing the resultant image files on a Samba share visible from my desktop computer. From there, on my desktop computer, I use Rainmeter with a created/tweaked skin that picks up the images plus the % used from the Samba share and displays them at the top of the screen on my desktop. A Cron job on the server runs the script on a regular basis, which only updates anything if the available/used output from du has changed.
If anyone is interested in more details, memail me.
posted by Nice Guy Mike at 8:53 AM on January 29, 2019
This thread is closed to new comments.
posted by qxntpqbbbqxl at 4:13 PM on January 19, 2019