Sampling Design for Spatial Statistics
November 4, 2013 11:01 AM Subscribe
I'm designing an experiment to measure the influence of the proximity of one type of geographic feature on another, but I am worried that my sampling design might introduce bias where many features are in close proximity.
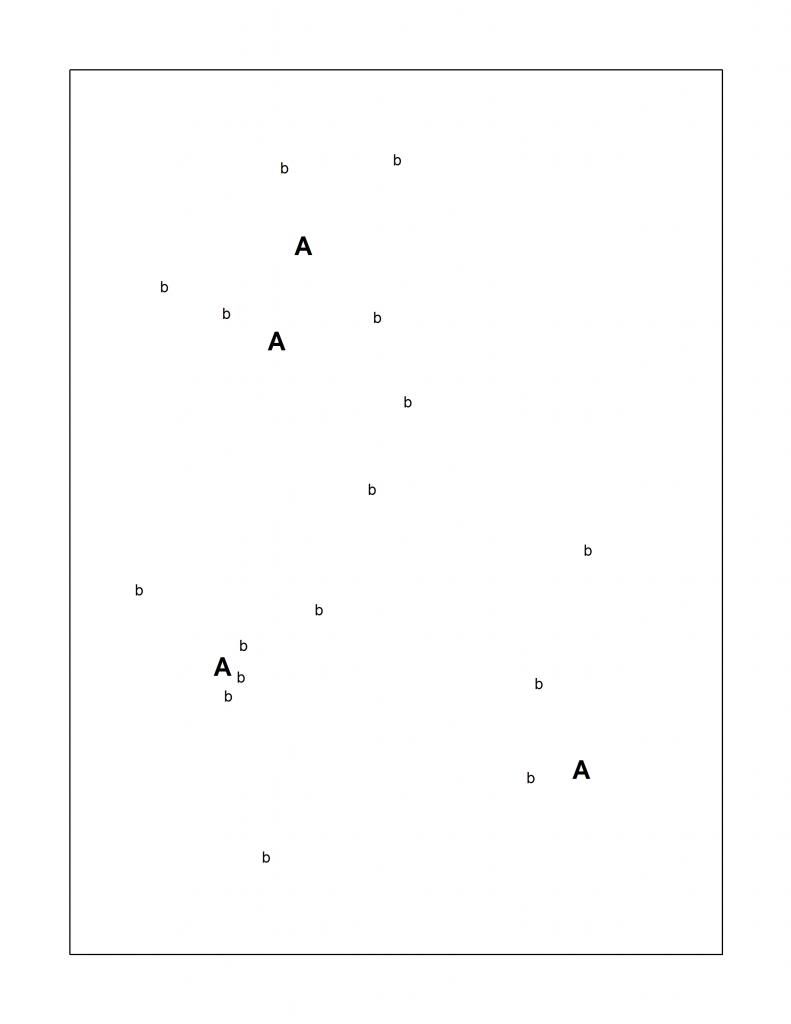
I have two types of objects in a landscape, A's and B's. There are several A's and many, many B's. They have static positions over the timeframe that I am interested in. (Simplified example)
A’s have a variable characteristic (a numeric score). I believe that B’s influence this numeric score based on their proximity. For example, having many B’s nearby should increase an A’s score. I would like to measure this influence.
I can quantify my independent variable by taking the sum of the inverse of the distance from each A to each B (IDW) (or maybe the sum of the inverse of the square of the distance? I haven’t decided which is most appropriate yet). Then I can run a linear regression of this IDW metric against the numeric score and look for an effect. So far, so good.
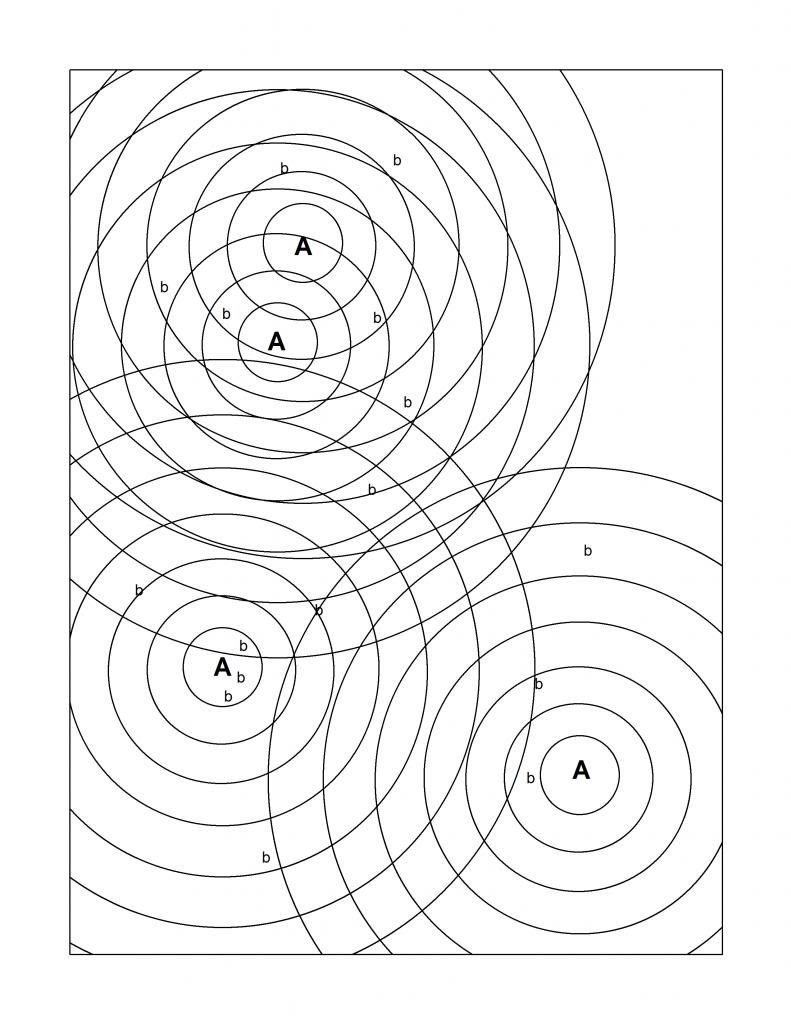
Now comes the part I am concerned about. My landscape is too large to accurately count and locate all the B’s. I will need to sample it instead. I could randomly stratify sampling plots (and stratify by distance from A, so that there would be some plots randomly placed in the 100m band, the 200m band, and so on). The trick is, the A’s are close enough to each other that their “areas of influence” would overlap, meaning one B can affect multiple A’s. (Example of what I mean). If I stratify this way, I will get B’s that could count toward multiple A’s. I could keep them separate—have a separate set of plots for each A, and don’t use the B’s I locate in the plots for A1 in the analysis of A2. That wastes a lot of sampling effort, and makes my sample size much smaller than it could be. I could combine all the plot data, but then my worry is this: if I count all the B’s against all the A’s, will I bias my sampling by over-representing some portions of the landscape? For example, any time multiple A’s are close together they will get much more sampling effort around them than the other A’s do.
Would it make more sense to just assign my plots randomly on a grid, rather than stratify by distance from each A?
Or should I do something more complicated, like calculate an IDW layer from the A's, and stratify my sampling based on that?
And finally, do you have any good resources for this type of analysis that I should be reading?
I have two types of objects in a landscape, A's and B's. There are several A's and many, many B's. They have static positions over the timeframe that I am interested in. (Simplified example)
A’s have a variable characteristic (a numeric score). I believe that B’s influence this numeric score based on their proximity. For example, having many B’s nearby should increase an A’s score. I would like to measure this influence.
I can quantify my independent variable by taking the sum of the inverse of the distance from each A to each B (IDW) (or maybe the sum of the inverse of the square of the distance? I haven’t decided which is most appropriate yet). Then I can run a linear regression of this IDW metric against the numeric score and look for an effect. So far, so good.
Now comes the part I am concerned about. My landscape is too large to accurately count and locate all the B’s. I will need to sample it instead. I could randomly stratify sampling plots (and stratify by distance from A, so that there would be some plots randomly placed in the 100m band, the 200m band, and so on). The trick is, the A’s are close enough to each other that their “areas of influence” would overlap, meaning one B can affect multiple A’s. (Example of what I mean). If I stratify this way, I will get B’s that could count toward multiple A’s. I could keep them separate—have a separate set of plots for each A, and don’t use the B’s I locate in the plots for A1 in the analysis of A2. That wastes a lot of sampling effort, and makes my sample size much smaller than it could be. I could combine all the plot data, but then my worry is this: if I count all the B’s against all the A’s, will I bias my sampling by over-representing some portions of the landscape? For example, any time multiple A’s are close together they will get much more sampling effort around them than the other A’s do.
Would it make more sense to just assign my plots randomly on a grid, rather than stratify by distance from each A?
Or should I do something more complicated, like calculate an IDW layer from the A's, and stratify my sampling based on that?
And finally, do you have any good resources for this type of analysis that I should be reading?
(Sample from within Voronoi subspaces)
posted by oceanjesse at 11:32 AM on November 4, 2013
posted by oceanjesse at 11:32 AM on November 4, 2013
Response by poster: I'm confused. Are you suggesting that I only include a sample plot in a point's data if the plot falls within the point's Voronoi polygon? I do want to include the effect a B might have on multiple A's. That is, if B1 is 10m from A1 but 500m from A2, I want to measure its effect on both. I just don't want to over-represent some areas in the sampling data if that will bias it.
Or are you suggesting that I stratify by Voronoi polygons but then let all the A's "share" data? Wouldn't that further bias my sampling effort toward A's in high-density areas?
posted by agentofselection at 12:06 PM on November 4, 2013
Or are you suggesting that I stratify by Voronoi polygons but then let all the A's "share" data? Wouldn't that further bias my sampling effort toward A's in high-density areas?
posted by agentofselection at 12:06 PM on November 4, 2013
If you made a Voronoi diagram using just As, and counted the number of B points contained within each Voronoi polygon, would that be a useful measurement for you?
posted by oceanjesse at 2:46 PM on November 4, 2013
posted by oceanjesse at 2:46 PM on November 4, 2013
Response by poster: That wouldn't capture what I'm looking for, which is a measure of how many B's are close to each A, independent of the distribution of the A's.
posted by agentofselection at 4:11 PM on November 4, 2013
posted by agentofselection at 4:11 PM on November 4, 2013
Sorry for potentially derailing this, but this is how I interpret your problem:
1. The landscape is a national park
2. The Bs are curious rock formations / points of interest (pre-determined)
3. The As are ice cream stalls
4. The numeric value of each A is the ice cream stall's daily revenue -- call it Ya
Your hypothesis is that stalls surrounded by more (and more proximate) rock formations sell more ice cream.
You're worried about sample size: your sample size is the number of ice cream stalls (As), not the number of ice cream stall+rock formation (A+B) combos. That is, if you put each A+B pair into your X-matrix (that you regress on), then you must cluster by A -- i.e., your "actual" sample size is still the number of As. Stacking here is just for convenience...
In light of this, I think your basic regression is
Ya = b0 + b1*X1 + b2*X2 + b2*X3 + ... + u
where
X1 -- # of As within 100 m radius
X2 -- # of As in the "ring" at a distance between 100 and 200 m
X3 -- # of As in the "ring" at a distance between 200 and 300 m
etc..
then test if b1 = b2 = b3 =... = 0
You can do a fancier version of this by stacking all A-B combos and then use linear + square regressors (like you said). But even if you do this, your "real" sample size is still the number of As. (And if your results are substantially different from the regression above, I would think that you messed up your standard errors somewhere.)
posted by yonglin at 6:04 PM on November 4, 2013
if you're already using the link function of inverse distance or one like it, then you're already assuming the B's closer to any particular A affect it more than the B's further away. sampling by concentrating on concentric circles would make the most sense because, implicit in your regression, is the assumption that the more further away a B is from an A, the smaller effect it will have.
you don't care that you're under-sampling the ones further away because they don't matter.
are you also looking at the characteristics of B's that affect A's?
regardless, the same logic applies.
if you want to look at how the distance from B's affect A's, then you need to estimate the distribution, or the parameters of the distribution.
posted by cupcake1337 at 8:34 PM on November 4, 2013
If you don't sample randomly, you could weight your observations by sampling effort, so that if you look 10 times harder for Bs a particular radius from A, you count each B you find 1/10 as much.
posted by leopard at 4:32 AM on November 5, 2013
posted by leopard at 4:32 AM on November 5, 2013
This thread is closed to new comments.
Is this helpful?
posted by oceanjesse at 11:30 AM on November 4, 2013