Stats/Maths filter: How do I solve a sigmoidal?
May 24, 2009 8:53 PM Subscribe
I am trying to fit my data onto a sigmoidal function. The fit won't be perfect, but I am stuck with it for now.
To help with this, I have been (very generously) given a spreadsheet that creates a sigmoidal curve if the values a, b, x0 and x are known. How do I get these values?
The excel spreadsheet that I have implements a three-parameter sigmoidal function.
All I know so far is that x is my cutoff (70th percentile) which is solved using the restructured equation.
I've scoured the interwebs for help on this, but I can't for the life of me figure out how to solve for a and b, and what x0 is meant to be. All online resources I have found so far are either really basic (what is a sigmoidal function), or too advanced (how to fit real-time PCR to a sigmoidal function).
Any help would be great.
I've used this online curve-fitting site before, with success. The general term for what you want to do is curve fitting, or least-squares fitting.
x0 is an offset that sets something like where the midpoint of the sigmoid is along the x-axis.
posted by pombe at 9:27 PM on May 24, 2009
x0 is an offset that sets something like where the midpoint of the sigmoid is along the x-axis.
posted by pombe at 9:27 PM on May 24, 2009
As far as I know, Excel doesn't really do least-squares type fits beyond linear models. As Stranger noted, other programs are probably better suited to the task.
posted by drpynchon at 9:44 PM on May 24, 2009
posted by drpynchon at 9:44 PM on May 24, 2009
Doing this doesn't involve solving for a and b, but rather optimizing the values given the data. You can do this in r with "nls". Excel is _really_ not suited to doing this kind of analysis. Here is a bit more information on using nls, here is some more (about nlm and nls).
posted by advil at 10:51 PM on May 24, 2009
posted by advil at 10:51 PM on May 24, 2009
it is not really clear what you're trying to do or what problems you're having from reading your question, but i can at least show you how to solve for any of the parameters.
[leaving out some algebra here, if you can't solve for a, you're in over your head]
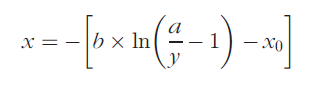
solve it for x0 and b by taking the natural log of both sides:
ln ( a/y - 1 ) = - ( x-x0 / b )
posted by sergeant sandwich at 11:08 PM on May 24, 2009
[leaving out some algebra here, if you can't solve for a, you're in over your head]
solve it for x0 and b by taking the natural log of both sides:
ln ( a/y - 1 ) = - ( x-x0 / b )
posted by sergeant sandwich at 11:08 PM on May 24, 2009
and as for the meanings of each parameter:
a describes the "height" of the sigmoid curve - the vertical extent along the y axis
b describes the "steepness" of the transitional part of the sigmoid
x0 offsets the transitional point to somewhere else on the x axis.
posted by sergeant sandwich at 11:12 PM on May 24, 2009
a describes the "height" of the sigmoid curve - the vertical extent along the y axis
b describes the "steepness" of the transitional part of the sigmoid
x0 offsets the transitional point to somewhere else on the x axis.
posted by sergeant sandwich at 11:12 PM on May 24, 2009
Response by poster: sargeant sandwich, knowing what the paramaters in the equation do helped a lot. Sorry about being unclear, too much coffee. What I have is a set of data (6 points), which sort of looks like a sigmoidal, but not really. What I want to do is try and approximate a sigmoidal using my data to be able to read off a particular percentile so I know which stimuli intensity to use. Getting more data per point or more actual points isn't feasible, so I'm trying to do the best I can with what I've got.
StrangerInAStrainedLand, I will have to give SigmaPlot another whirl. It was taking forever initially to try and fit a curve to my data so I was given an excel sheet which does the same thing. For those wondering, the excel spreadsheet is very heavily modified, and produces the plot and 200 percentile points based on user defines a, b, x0 and x.
advil, thanks, it's starting to sink in now.
pombe, least-squares fitting sounds incredibly familiar, but this seems to be one of those situations where I can't remember why. Looks like I have a bit more reading ahead of me :)
I'm going to give the suggested methods, particular SigmaPlot, a solid try and will see what happens. Those interested might want to check back tomorrow :).
posted by doctor.dan at 1:01 AM on May 25, 2009
least squares fitting is pretty simple:
the basic idea is you want to quantify how well some curve matches the data. subtract the y value of one of your data points from the value of the curve at the same x point. this difference1 is called a "residual". do this for all of your data points. then take all your residuals, square each one, and add them all up. this is called the "sum of the squares" and the larger it is, the worse your fit is. if the sum of squares is zero, that means all your residuals are zero, and your curve fits your data exactly.
(why square them? it eliminates the possibility of negative and positive residuals canceling each other out.)
the "least" in least-squares comes in where you let a computer vary the parameters a, b, x0 in order to minimize the sum of squares. this is what the curve fitting software does - varies the parameters in some random way, calculating the sum of squares with each variation, and only keeps changes that make the sum of squares smaller.
the point i'd like to make is that least-squares fitting is an algorithmic way to fit a curve to some data. human eyes and brains are actually pretty good at doing this though, albeit in a quick and dirty way.
so, if you're having trouble getting the least-squares fitting tools to work properly, you could just plot your data points and the curve-generated data together, on the same graph in excel. then start adjusting a, b, and x0 until you've got what looks like the best fit to your eyes. this is a qualitative method and not at all appropriate for actual data analysis or publication, but if you just need a quick tool to get something done, i say go for it.
1 lest some statistician come in here and complain, this is called a vertical offset residual, and it's not the only way of calculating residuals. there are others, but this is the most common way of doing it.
posted by sergeant sandwich at 2:55 AM on May 25, 2009
This thread is closed to new comments.
Feel free to MeFi mail me for help - I'm fairly familiar with Prism at least.
posted by StrangerInAStrainedLand at 9:21 PM on May 24, 2009