Past performance, future results, &c
March 6, 2008 8:34 AM Subscribe
Statistics-filter: I need to establish to what extent student performance on a particular standardized test is predicted by each of the following: GPA, standardized test scores and a couple of other miscellaneous numerical factors. How do I go about this?
I have a fairly large database of student scores on a particular standardized test that is of primary interest to me. Each student record also contains grade point average information and that student's scores on a couple of other standardized tests.
What statistical techniques can I use to analyze how predictive each of a student's other numbers is of their ultimate performance on the standardized test of interest?
I'm handy with Excel and of a fairly technical bent, but I know almost nothing about statistical analysis. Both direct assistance and pointers to relevant information on the Web would be greatly appreciated!
ps - You might want to see the Little Handbook of Statistical Practice and Jerry Dallal's notes on regression
posted by tiburon at 9:06 AM on March 6, 2008
posted by tiburon at 9:06 AM on March 6, 2008
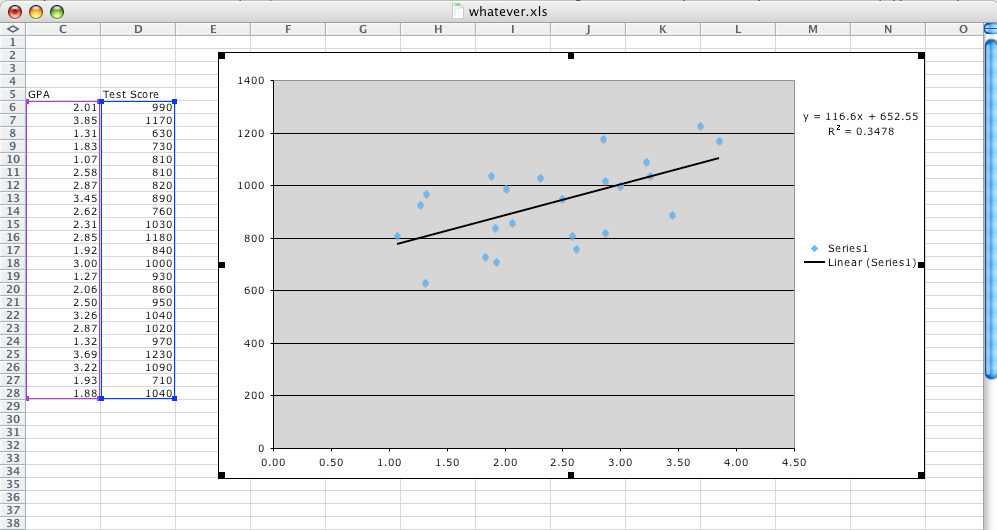
The cheapest way to get a numerical measurement that reflects what you want is to do plot the standardized test score (Y) vs the other variable (X, say the GPA), and get a line of best fit. In Excel, this can actually be added directly to the plot using "Add trendline / linear" with "Display R^2 value" set in the options. You'll get something like this or this.
The closer that R^2 value is to 1, the stronger the correlation is. R^2 close to 0 means essentially no correlation. So the first example shows scores on a hypothetical SOL test that are strongly correlated to the standardized test result, and the second example shows GPAs that are not very strongly correlated to the standardized test result.
There's also a special regression tool that I don't have right here that well let you select a block of data and print out the r^2 value (along with some other stuff) rather than putting it on a chart.
This is OK for getting a rough impression for your own curiosity and amusement If you don't really understand what it's doing, don't make any important decisions based on it.
posted by Wolfdog at 9:17 AM on March 6, 2008
Doing a multifactor linear regression is what you want to do. This is easily done in Excel. Regression basically tries to explain a variable Y in terms of explanatory variables: X1, X2, X3. In your case, Y would be the particular standardised test whose score you want to predict, X1 might be GPA, X2 might be other test.
As tiburon points out, regression tries to fit Y (Score) = Intercept (this is just a constant number to get a better fit) + X1 (GPA) + X2 (another test) + X3 (another test). The regression will produce numbers that you can then mutliply your values for X1 etc by to get a predicted score. These multiplication values are called coefficients.
As an example: A table with each row representing a separate student. Student score on particular standardised test in column A rows 1 to 100. GPAs and other explanatory variables in columns B - E, must have complete data for each student otherwise the results will be messed up. Row 1 has the names of the variable in each column.
Go to Excel, tools (if you're in excel 2007 it's under the data tab on the ribbon), data analysis and then select regression. If you don't have data analysis showing, you'll need to install the excel add-in "analysis toolpack" (tools ->addins)
The "Y" variable is the one you want to explain using the others and hence will be A1:A100. The "X" variables are the ones you want to use to explain Y. Therefore you'll enter B1:E100. Make sure to check the box where it says "labels". Then select where you want the results output to, and click OK.
Others can probably explain the output better than I can, but the adjusted r squared result tells you how much of y has been explained by your x variables. Closer to 1, the better. Towards the end of the results, you'll see each of x variables plus an intercept. The first column called Coefficient are the multiplication values referred to above. The t-stat tells you whether or not the variables you used to explain Y are actually meaningful. Without getting too much into statistics, if your t-stat is above 2 or less than -2 you can probably assume the variable is meaningful.
For example. if the results give an intercept with coefficient of 0.05 (t stat 4), GPA coefficient of 2 (t stat 12), another test coefficient of .52 (t stat 1.2), and yet another test coefficient of .7 with t stat -3 then this is how you would predict the score:
Predict score = 0.05 + (2 x GPA score) + (.0.7 x yet another test score). Note we discounted the "another test" since its T stat wasn't high enough.
posted by Mave_80 at 9:17 AM on March 6, 2008
Regression. Plain-vanilla OLS will do to start with. You're going to get lots of suggestions about checking the normality of your data and questioning whether your independent variables are fully independent and suggesting running fixed effects for classes. But if you didn't already know that this is a regression problem, trust me when I say that these concerns will go over your head for the time being. Here is what you need to know about all of that stuff:
If this is at all serious, then when you are done take your results to someone who does know statistics to talk about what issues you might have. There are a multitude of ways to fuck this up.
Do not do regression in Excel. Excel fucks up. You need statistical software like Stata or SPSS or, if free is important, R or gretl. You'll need to get the data into a flat file if it isn't already, but for the most part once it's a flat Excel file all you need to do is save it as a csv and just about any statistical package can read it.
Let's say you were using Stata, and your variables were:
score: the thing you want to explain
gpa: gpa
test: some other test score
male: 1 if the student is male, 0 otherwise
shoe: the student's shoe size
Then you would type in
regress score gpa test male shoe
and you'd get back something that looks like this
All that stuff at the top: forget about it. This is of interest to your friend who knows OLS.
The "coef" column is the estimated effect of each variable HOLDING THE OTHERS CONSTANT. That is, the independent effect of each. The number is the change in "score" that results if you increase that variable by 1. So the 0.017 for gpa means that if you increase GPA by 1, you see score go up 0.017 points. And the -0.045 for male means that if you increase male by 1 -- that is, if the student is male instead of female -- then the score should go down by 0.045.
the "p>|T|" column tells you how certain you are that the results aren't just from random crap. Low numbers are better. 0.050 is a common standard to separate stuff worth talking about from stuff that isn't.
The row for "_cons" is the constant, which is the expected score for someone who has a zero on every variable. It's a baseline to operate from.
The one thing you need to be aware of for now is that if you have a bunch of variables that all boil down to the same thing, you're going to have problems. If GPA and the other test score and some other things are all highly related, then you're not going to be able to find the independent effects of each of them. This is called "multicollinearity." This is one of the big things to ask someone else about.
posted by ROU_Xenophobe at 9:20 AM on March 6, 2008
If this is at all serious, then when you are done take your results to someone who does know statistics to talk about what issues you might have. There are a multitude of ways to fuck this up.
Do not do regression in Excel. Excel fucks up. You need statistical software like Stata or SPSS or, if free is important, R or gretl. You'll need to get the data into a flat file if it isn't already, but for the most part once it's a flat Excel file all you need to do is save it as a csv and just about any statistical package can read it.
Let's say you were using Stata, and your variables were:
score: the thing you want to explain
gpa: gpa
test: some other test score
male: 1 if the student is male, 0 otherwise
shoe: the student's shoe size
Then you would type in
regress score gpa test male shoe
and you'd get back something that looks like this
      Source |       SS       df       MS              Number of obs =    2053
-------------+------------------------------           F(  5,  2047) =   32.22
       Model |  10.7422406     5  2.14844813           Prob > F      =  0.0000
    Residual |  136.513135  2047  .066689367           R-squared     =  0.0729
-------------+------------------------------           Adj R-squared =  0.0707
       Total |  147.255376  2052  .071761879           Root MSE      =  .25824

------------------------------------------------------------------------------
       score |      Coef.   Std. Err.      t    P>|t|     [95% Conf. Interval]
-------------+----------------------------------------------------------------
       gpa   |   .0172763   .0166367     1.04   0.299    -.0153502    .0499028
       test  |   .0288454   .0116055     2.49   0.013     .0060857    .0516052
      male   |  -.0452193   .0119055    -3.80   0.000    -.0685675    -.021871
      shoe   |  -.0062415   .0006485    -9.62   0.000    -.0075133   -.0049697
       _cons |   1.014789   .0401596    25.27   0.000     .9360307    1.093547
------------------------------------------------------------------------------
What this gobbledygook means is this:All that stuff at the top: forget about it. This is of interest to your friend who knows OLS.
The "coef" column is the estimated effect of each variable HOLDING THE OTHERS CONSTANT. That is, the independent effect of each. The number is the change in "score" that results if you increase that variable by 1. So the 0.017 for gpa means that if you increase GPA by 1, you see score go up 0.017 points. And the -0.045 for male means that if you increase male by 1 -- that is, if the student is male instead of female -- then the score should go down by 0.045.
the "p>|T|" column tells you how certain you are that the results aren't just from random crap. Low numbers are better. 0.050 is a common standard to separate stuff worth talking about from stuff that isn't.
The row for "_cons" is the constant, which is the expected score for someone who has a zero on every variable. It's a baseline to operate from.
The one thing you need to be aware of for now is that if you have a bunch of variables that all boil down to the same thing, you're going to have problems. If GPA and the other test score and some other things are all highly related, then you're not going to be able to find the independent effects of each of them. This is called "multicollinearity." This is one of the big things to ask someone else about.
posted by ROU_Xenophobe at 9:20 AM on March 6, 2008
Follow this guide for a general walk-thru of OLS regression in excel. The dependent variable (the one you want to predict) is the y, the predictor variables are the x's. The only thing you need to change is to make sure you include all of the columns of predictor variables when inputting the x range, (this tutorial only uses 1 predictor variable).
It is OK to do this in excel--it is perfectly capable of transposing and multiplying matrices to calculate your coefficients. The excel output will be correct based on the simple model you fed it. As others have pointed out, only use the results for a back-of-the-envelope type of informal analysis--consult your local friendly statistician for guidance in building a more complex model if you really want to use the regression results for something important.
If you need more help, my email is in my profile.
posted by jtfowl0 at 9:50 AM on March 6, 2008
ROU's advice is very very very important:
If this is at all serious, then when you are done take your results to someone who does know statistics to talk about what issues you might have. There are a multitude of ways to fuck this up.
posted by tiburon at 10:30 AM on March 6, 2008 [1 favorite]
If this is at all serious, then when you are done take your results to someone who does know statistics to talk about what issues you might have. There are a multitude of ways to fuck this up.
posted by tiburon at 10:30 AM on March 6, 2008 [1 favorite]
It is OK to do this in excel--it is perfectly capable of transposing and multiplying matrices to calculate your coefficients. The excel output will be correct based on the simple model you fed it.
Unless they've changed things, ISTR some very dire warnings about how Excel really does screw up regression by taking some illegitimate shortcuts and using flatly incorrect formulas.
posted by ROU_Xenophobe at 10:52 AM on March 6, 2008
Unless they've changed things, ISTR some very dire warnings about how Excel really does screw up regression by taking some illegitimate shortcuts and using flatly incorrect formulas.
posted by ROU_Xenophobe at 10:52 AM on March 6, 2008
@ROU: Do you have a link? I'd be curious to see what the issues are. I've done regressions on identical datasets in excel and stata with identical results, but maybe I was just lucky.
The only thing I can think of is that excel has no pre-canned ability to do the Huber-White correction for heteroskedasticity, which would bias standard errors but not coefficients (if I am remembering correctly). Obviously you shouldn't be using excel for time series, logit, etc. but for plain old vanilla OLS I've never seen any problems.
Sorry for the derail.
posted by jtfowl0 at 1:03 PM on March 6, 2008
No link I can recall. Googling for "excel regression bad" turned up this.
But mostly just lore, I'll admit, backed up with knowing that excel does use some invalid shortcuts or bad numerical algorithms.
posted by ROU_Xenophobe at 1:37 PM on March 6, 2008
But mostly just lore, I'll admit, backed up with knowing that excel does use some invalid shortcuts or bad numerical algorithms.
posted by ROU_Xenophobe at 1:37 PM on March 6, 2008
There's a series of articles (paywalled) by two authors evaluating the computational accuracy of various versions of Excel. For Excel 2003 they say the handling of linear regression is "acceptable," though not great. I don't see a report on Excel 2007 yet.
posted by shadow vector at 4:40 PM on March 6, 2008
posted by shadow vector at 4:40 PM on March 6, 2008
« Older What to do with an old iBook and iPod? | Exporting my xsession is this close to working out... Newer »
This thread is closed to new comments.
The outcome (Y) variable will be the score on the standardized test. You will make a model that will predict the mean score on the test, given the dependent variables (the X variables).
Score = Intercept + Slope1*(GPA) + Slope2*(OtherTest) + Slope3*(Misc1) + Slope4*(Misc2) + etc.
I don't know how to do regression in Excel. You can download a trial copy of SPSS and try that.
posted by tiburon at 9:05 AM on March 6, 2008