Visual data organization.
June 1, 2006 8:00 PM Subscribe
I would like to make a chart like this to track my daily computer usage. Any ideas on how I could do this? Any free software you can recommend? Any way of doing it with Excel?
The creater of the chart I linked to sells his own software, but it's meant for keeping track of baby lifestyle data and looks like it's a bit more than I need anyway.
I'm particularly interested in being able to specify unique start and end times for each block of computer usage.
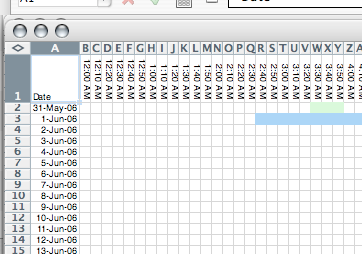
The closest I've come to what I want is this, but since it's in an Excel spreadsheet I can't specify start and end times the way I'd like to and intervals sort of overlap since a box is specifying each ten minute interval instead of a point.
The creater of the chart I linked to sells his own software, but it's meant for keeping track of baby lifestyle data and looks like it's a bit more than I need anyway.
I'm particularly interested in being able to specify unique start and end times for each block of computer usage.
The closest I've come to what I want is this, but since it's in an Excel spreadsheet I can't specify start and end times the way I'd like to and intervals sort of overlap since a box is specifying each ten minute interval instead of a point.
My vote? Used *Stacked Sparklines.* Here's the Edward Tufte discussion (and article) about them.
Here's a PHP library, and a very good description of them from an InfoViz online magazine.
The hard part about this is that it's going to require *some* programming chops to make it work. This is not a super simple thing, but it's pretty well supported. So maybe you could download the sample code and hack it up from there.
For the Mac, there was some software I ran for a hot second called Onlife. It does pretty much exactly what you want. Here's a screenshot:

posted by zpousman at 5:46 AM on June 2, 2006
Here's a PHP library, and a very good description of them from an InfoViz online magazine.
The hard part about this is that it's going to require *some* programming chops to make it work. This is not a super simple thing, but it's pretty well supported. So maybe you could download the sample code and hack it up from there.
For the Mac, there was some software I ran for a hot second called Onlife. It does pretty much exactly what you want. Here's a screenshot:
posted by zpousman at 5:46 AM on June 2, 2006
By the way, you say that you want to "specify unique start and end times," like: 10:37, launched Word. But you don't. You'll never keep this up. So you need to do it automatically. This is what computers were invented for -- to keep track of things that you are not good at (or are too busy for doing human things!).
posted by zpousman at 5:49 AM on June 2, 2006
posted by zpousman at 5:49 AM on June 2, 2006
Do you have MS Office? The Journal will allow you to do this, but it's only as fine-grained as you make it.
posted by Mr. Gunn at 8:23 AM on June 2, 2006
posted by Mr. Gunn at 8:23 AM on June 2, 2006
Response by poster: Oops, it's probably a little late to add this (that's what I get for posting a question and then going to sleep) - I don't necessarily need my chart to keep track of things automatically, since I've been pretty good so far about keeping track of my start and end times myself. I just need it to let me hand-enter the specific times that I collect.
Also, I am on a Mac.
posted by bubukaba at 11:06 AM on June 2, 2006
Also, I am on a Mac.
posted by bubukaba at 11:06 AM on June 2, 2006
This thread is closed to new comments.
Standardizing or automating the collecting is what I think is going to be a larger challenge, of course with rrdtool and some other tools you can collect data on various points of utilization on your system(s).
Requires some technical know how, but worth it in the end.
posted by iamabot at 8:55 PM on June 1, 2006