Best 3d graphing app for a cheapskate?
December 18, 2008 10:07 PM Subscribe
Best application for 3D graphing (heat maps, contours, bump maps and so on)?
I have some data, mostly 3D and the data in higher dimensions can generally be reduced to 3D for analysis.
A typical dataset has a value for several hundred (x,y,z) triples where I want to map z as a function of x and y, in a heat map, bump map, or contour form. The actual form doesn't matter... it just needs to be easily readable.
To take a specific example, I could have x = 1, 2, 3 ... 39, 40 and y = 10, 20, 30 ... 490, 500, with z varying between -500 and +500. I'd like to view this data as an (x, y) grid with the z values represented as heights, or colors, or something else.
Prettily.
I've tried both Excel and Numbers and neither really cuts it. I don't want to shell out for MatLab or anything like that. So I'm wondering if there's a good opensource/freeware/shareware solution to this?
I'm mosty Mac but happy to run a Windows app in VMWare.
R is also has multiple graphing add ons in addition to the base functions, can take data from an excel spreadsheet, has it's own programming language for functions, and the graphs can be easily modified on the fly.
Since it's open source and free, it's also incredibly popular for presentations at international conferences in a variety of fields.
posted by gryftir at 11:04 PM on December 18, 2008
Since it's open source and free, it's also incredibly popular for presentations at international conferences in a variety of fields.
posted by gryftir at 11:04 PM on December 18, 2008
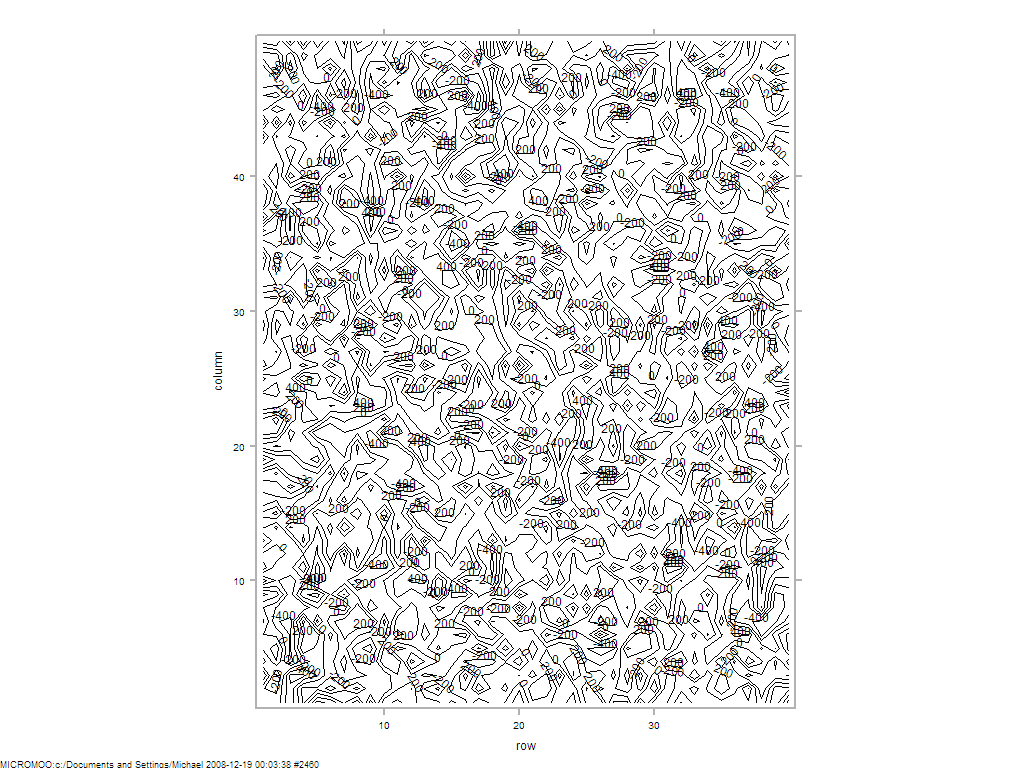
Here's some R code that generates a 40 × 50 matrix with values uniformly and randomly picked from [-500, 500]:
posted by grouse at 12:06 AM on December 19, 2008
> z <- matrix(runif(40 * 50, -500, 500), 40, 50)

> levelplot(z)

> contourplot(z)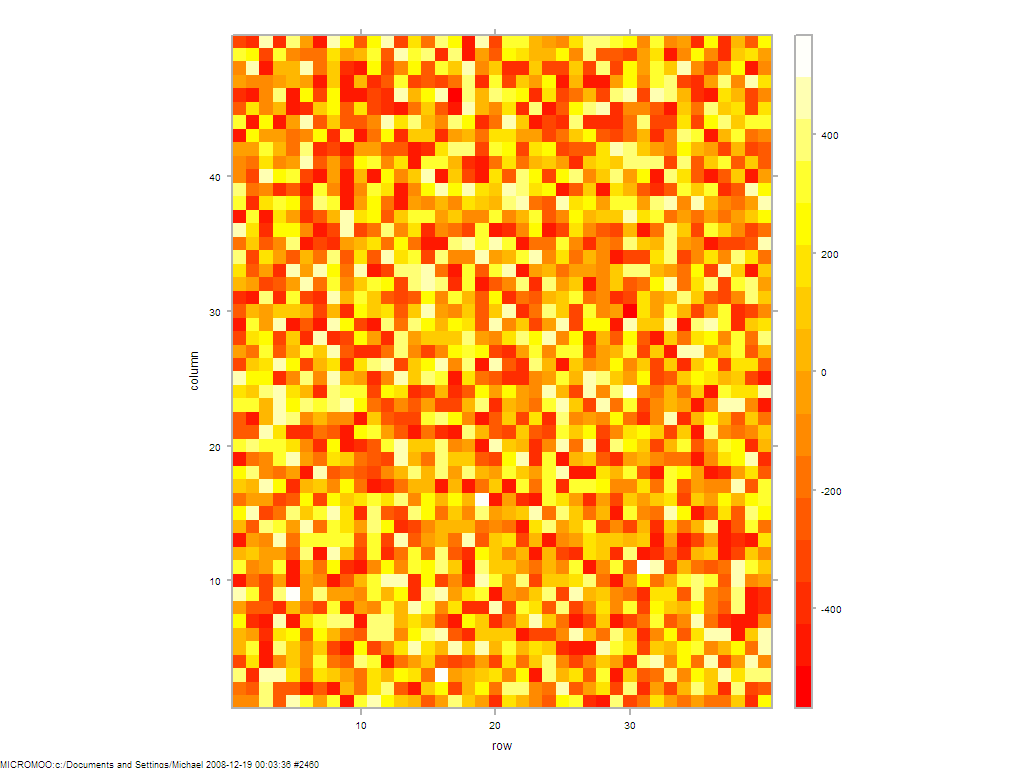
posted by grouse at 12:06 AM on December 19, 2008
I use Gnuplot with the python bindings. I love python.
posted by magikker at 12:30 AM on December 19, 2008
posted by magikker at 12:30 AM on December 19, 2008
Octave is a free matlab clone (which plots via Gnuplot). Matlab is well-documented, and 95% of that documentation will apply to Octave.
Also, on the Python side, Matplotlib is freaking amazing.
posted by dmd at 6:12 AM on December 19, 2008 [1 favorite]
Also, on the Python side, Matplotlib is freaking amazing.
posted by dmd at 6:12 AM on December 19, 2008 [1 favorite]
This thread is closed to new comments.
R is open source and free for every platform.
posted by eisenkr at 10:23 PM on December 18, 2008 [1 favorite]