Rolling Averages in Excel?
May 21, 2006 8:51 AM Subscribe
Excelfilter: how do I compute a rolling seven-day average for something that happens at sporadic intervals?
I keep an exercise log and I'd like to have both entries for how much I'm swimming as well as how much swimming I've done in the preceding seven days [not like a Sunday to Saturday week, just the last seven days] and how it compares to previous seven day increments. I swim four out of seven days on no particular schedule. My spreadsheet, such as it is, looks like this, with about seven months of data.
Date Laps
1/2/06 17
1/3/06 27
1/6/06 24
. .
. .
. .
I've got a chart with daily values over time and a trendline. I'd really like to be able to figure out how to make a chart with just seven day averages, but I'm not sure how to go about it. Most of the examples I've seen are for things where there are regular data elements that need to be dealt with, like daily revenues. I'm good with spreadsheets in general, but not super smart with functions so the more explanation the better where functions are involved. Thanks.
Response by poster: Copying and pasting that formula into each successive cell in the row will get you your moving average.
Thank you. I do have the data analysis option, but won't this just get me the average of the last seven entries instead of the last seven days? My problem is that some weeks I swim five days and some weeks I swim two. I know that I can make a chart that has every day on it and just fill in the second column for the days I swim, but it seems like Excel knows how to parse dates so that if I could figure out the magic formula, I could avoid this extra work.
posted by jessamyn at 9:15 AM on May 21, 2006
You want it to average for the days that aren't recorded too? That's a bit more complex -- it's hard to consider data that isn't there.
posted by boo_radley at 9:49 AM on May 21, 2006
posted by boo_radley at 9:49 AM on May 21, 2006
This would go better in a database. ;)
That said, the "simplest" solution would probably be to make judicious use of the SUMIF function. Personally, I'd set it up as follows:
Assume that your date/laps table is in a range named "MyLaps."
Set up a parallel table (in the same sheet, or another sheet, doesn't matter) with one row per week, each row containing the week start date and week end date (e.g., 1/1/2006 and 1/7/2006) in columns A and B. Then in cell C, put the following formula:
=(SUMIF(MyLaps,">="&A3,B:B)-SUMIF(MyLaps,">="&B3,B:B))/(COUNTIF(MyLaps,">="&A3)-COUNTIF(MyLaps,">="&B3))
For the first row (1/1/2006 - 1/7/2006), you're basically saying "Total laps on or after 1/1/2006 MINUS Total laps on or after 1/8/2006 (e.g., total laps from 1/1 - 1/7). Divide by the number of times I did laps during that same interval.
posted by Doofus Magoo at 9:54 AM on May 21, 2006
... the formula posted above assumes that you're starting your "Weekly Table" on row 3 (i.e., it references cells A3 and B3). Those may need to be corrected if you start your "Weekly Table" in a different row.
posted by Doofus Magoo at 9:56 AM on May 21, 2006
posted by Doofus Magoo at 9:56 AM on May 21, 2006
Jeez, sorry -- one more assumption. The formula assumes that your "MyLaps" range is in columns A and B (i.e., references to A:A and B:B).
I'll also point out that for your second row in the "Weekly Table," instead of typing the dates for the second week, you can add 7 to the dates in the first row. That way you can just copy the entire row down for as many weeks as you need to do it.
posted by Doofus Magoo at 10:00 AM on May 21, 2006
I'll also point out that for your second row in the "Weekly Table," instead of typing the dates for the second week, you can add 7 to the dates in the first row. That way you can just copy the entire row down for as many weeks as you need to do it.
posted by Doofus Magoo at 10:00 AM on May 21, 2006
Response by poster: Thank you. The assumptions are getting a little ahead of me. Let me make clearer exactly what I have. One worksheet, called "laps". In column A I have dates I swam, header is "date". In column B I have number of laps for days I swam. Header is "amount" Column C is blank. In column D and E I now have dates where column D is start of week date and column E is end of week date. Headers are "begin" and "end"
Doofus, I think I am confused which A and B you mean. When I input the formula you give me, I'm not sure what to change MyLaps to. If I change it to "amount" I get a number that doesn't seem right [I get 20.2 when that week I only swam 12 and 18 laps] Maybe I'm not as good at Excel as I thought? Given the data I have I'd like to be able to plot what the average laps-per-day I have swum is, and I figured a rolling seven day average was an okay way to do this, but maybe I can do it as just an average year-to-date?
posted by jessamyn at 11:19 AM on May 21, 2006
How about a nice excel template. These are direct from Microsoft, but there are others on the internet. Maybe one will fit your needs and do the work for you.
Good luck!
posted by bim at 11:40 AM on May 21, 2006
Good luck!
posted by bim at 11:40 AM on May 21, 2006
Not answering the original question (it's doable, but to my knowledge a PITA in Excel) but offering another option.
You might want to consider comparing each day's laps to what I'll call a "moving average with decay" (I'm ignorant of the fancy math name for this technique, if there is one.) This will smooth out the bumps in your data.
Add a column -- call it "MAWD" or whatever. For the first date just enter the same value as the laps entry. For subsequent dates add 90 percent of the previous MAWD value to 10 percent of that day's laps -- this value will reflect trends in your performance while not being too affected by one off day (or a day when you pushed yourself extra hard); thus, it should serve as a good benchmark of your progress. I've used this technique before to track my weight and it's a good way to keep from agonizing over temporary blips.
Email me if you want a worked-out example in Excel.
posted by Opposite George at 11:47 AM on May 21, 2006
Doofus, I think I am confused which A and B you mean. When I input the formula you give me, I'm not sure what to change MyLaps to. If I change it to "amount" I get a number that doesn't seem right [I get 20.2 when that week I only swam 12 and 18 laps] Maybe I'm not as good at Excel as I thought? Given the data I have I'd like to be able to plot what the average laps-per-day I have swum is, and I figured a rolling seven day average was an okay way to do this, but maybe I can do it as just an average year-to-date?Assuming that your "date/amount" data start in A2:B2, and that your "begin/end" data start in D2:E2, then this formula would go in F2:
=(SUMIF(A:B,">="&D2,B:B)-SUMIF(A:B,">="&E2,B:B))/(COUNTIF(A:B,">="&D2)-COUNTIF(A:B,">"&E2))
posted by Doofus Magoo at 1:16 PM on May 21, 2006
Feh, sorry, that should be:
=(SUMIF(A:B,">="&D2,B:B)-SUMIF(A:B,">"&E2,B:B))/(COUNTIF(A:B,">="&D2)-COUNTIF(A:B,">"&E2))
(changed the second ">=" to just ">")
posted by Doofus Magoo at 1:29 PM on May 21, 2006
=(SUMIF(A:B,">="&D2,B:B)-SUMIF(A:B,">"&E2,B:B))/(COUNTIF(A:B,">="&D2)-COUNTIF(A:B,">"&E2))
(changed the second ">=" to just ">")
posted by Doofus Magoo at 1:29 PM on May 21, 2006
I'm going to second the database opinion. This would be very easy with SQL, and most tools have an option to import CSV data.
posted by devilsbrigade at 1:38 PM on May 21, 2006
posted by devilsbrigade at 1:38 PM on May 21, 2006
You have all the weekly data -- the days when you didn't swim, the number of laps is zero. So fill in the zeroes and the rest of it will be easy. Your weekly average will be much lower than the number of laps you swim on any given day, of course, but that doesn't matter, as it won't affect your ability to see trends.
It'll also make any weeks you slacked off and didn't swim 4 days stand out in your graph quite starkly...
posted by kindall at 8:17 PM on May 21, 2006
It'll also make any weeks you slacked off and didn't swim 4 days stand out in your graph quite starkly...
posted by kindall at 8:17 PM on May 21, 2006
Best answer: Probably late to the party here, but you can implement Doofus Magoo's method without plugging in start/end dates, and just adding one column to your original table:
Say the dates are in column A, and laps are in column B. We'll put the moving average in column C. Say your first data row is row 3. Put this formula in cell C4:
=SUMIF(A$3:A3;">="&A4-7;B$3:B3)/COUNTIF(A$3:A3;">="&A4-7)
Copy this formula down the column. Voila.
posted by Opposite George at 8:28 PM on May 21, 2006 [1 favorite]
BTW, that gives you avg. laps / session over the previous 7 days. If you'd prefer to get kindall's number (avg. laps per day over previous seven days,) just throw the COUNTIF part out, and divide by 7.
posted by Opposite George at 8:31 PM on May 21, 2006
posted by Opposite George at 8:31 PM on May 21, 2006
Best answer:
Having not had my daily allotment of coffee, I may be off-base, but as written, however, it looks like OG's formula will give you the "average laps swum since one week before this date" since it doesn't include an upper bound on the dates. That is, for lap records from January, it will average laps from January - present. For lap records from July 2004, it will average laps from July 2004-present. For the most recent week, however, the average will be valid.
If you want to look at the average between dates X and Y, I'm pretty sure you have to use two COUNTIF/SUMIF statements; e.g. the following formula in cell C3:
=(SUMIF(A:A,">="&(A3-7),B:B)-SUMIF(A:A,">"&A3,B:B))/(COUNTIF(A:A,">="&A3-7)-COUNTIF(A:A,">"&A3))
posted by Doofus Magoo at 3:58 AM on May 22, 2006
=SUMIF(A$3:A3;">="&A4-7;B$3:B3)/COUNTIF(A$3:A3;">="&A4-7)The elegance of this solution appeals to me greatly (as OG pointed out, this will give you more of a true "moving average" over the last seven days instead of averaging by arbitrary calendar weeks); I think it may be a bit inaccurate, however.
Having not had my daily allotment of coffee, I may be off-base, but as written, however, it looks like OG's formula will give you the "average laps swum since one week before this date" since it doesn't include an upper bound on the dates. That is, for lap records from January, it will average laps from January - present. For lap records from July 2004, it will average laps from July 2004-present. For the most recent week, however, the average will be valid.
If you want to look at the average between dates X and Y, I'm pretty sure you have to use two COUNTIF/SUMIF statements; e.g. the following formula in cell C3:
=(SUMIF(A:A,">="&(A3-7),B:B)-SUMIF(A:A,">"&A3,B:B))/(COUNTIF(A:A,">="&A3-7)-COUNTIF(A:A,">"&A3))
posted by Doofus Magoo at 3:58 AM on May 22, 2006
Doofus Magoo,
I haven't had my morning coffee yet either, so no guarantees here but yes, our formulas give different results but not for the reason you think; it looks like your formula is actually calculating an eight-day moving average, including the date in A3.
Add an equals sign to your second compare and our formulas will agree. At least that's how it worked out on my spreadsheet.
posted by Opposite George at 9:06 AM on May 22, 2006
You're right. But wouldn't we want instead to either change the "A3-7" to "A3-6" or the first ">=" to ">" (that is, for laps on Saturday, we want to look backwards to Sunday, not to the previous Saturday)? By changing the ">" to ">=" we're excluding the current day's laps from the week's average.
posted by Doofus Magoo at 10:22 AM on May 22, 2006
posted by Doofus Magoo at 10:22 AM on May 22, 2006
Whether you include the current day in the week's average is strictly a matter of taste.
Today's laps make up 25% of the number calculated using the second method, so my feeling is that a comparison between that and today's number gives you less information than one between today's laps and the seven days leading up to today. Plus, the second method keeps the historical data separate from today's data, which is easier for me to wrap my head around.
Ultimately, there is no single "right" way. This exercise really is one of decreasing a complex series' information content sufficiently that we can draw simple conclusions with our puny human brains. The key is understanding what goes into the smushed numbers we end up with so our interpretations make sense.
posted by Opposite George at 12:28 PM on May 22, 2006
Response by poster: I tried both OG and DMs solutions and for some reason I get an error in Excel when I try this one but the longer one (the eight day average) seem to work and do what I'd like it to do. You can see the new chart here
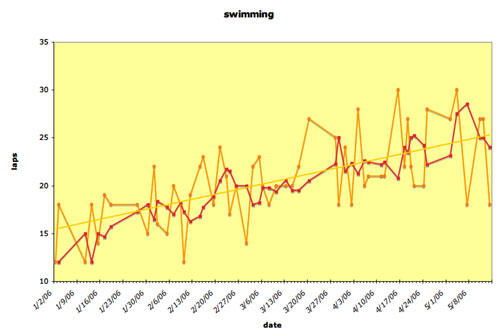
Where the yellow line is the trend line, the orange line is just the raw laps data and the red line is the average over eight days which is a little more useful and a little less all over the place. If anyone can show me how to troubleshoot OGs function (or feel free to email me) that would be super. Thanks very much.
posted by jessamyn at 1:36 PM on May 22, 2006
Response by poster: I could have also checked that there weren't swim logs available elsewhere. While these don't do exactly what I want, it's good to see them available.
posted by jessamyn at 4:04 PM on May 26, 2006
posted by jessamyn at 4:04 PM on May 26, 2006
This thread is closed to new comments.
If you don't have the Data Analysis option, or want a way to do it while you're still gathering your data, I might make a new column of data called "Moving average" next to "Laps". Its entries would look like (assuming your data really starts in cell B2)
=Average(B2:B8). Copying and pasting that formula into each successive cell in the row will get you your moving average.posted by boo_radley at 9:05 AM on May 21, 2006