NCAA's as a Probability Primer
March 13, 2006 6:51 PM Subscribe
So lets say I've got probabilities for 64 teams...
So I've got the pythagorean winning % for each team in the tourney. Using one of the Bill James Sabermetric formulas "log5" I can supposedly forecast the likelihood of one team winning over another using these #'s. The formula works out to P(A) = (A-A*B)/(A+B-(2*A*B). Right all well and good. Then I think it should follow that the Probabiity of Team A winning in the second round should be - (P(C)*((A-A*C)/(A+C-(2 *A*C)))+P(D)*((A-A*D)/(A+D-(2*A*d))))*P(A). And similarly for the other teams in the second round. My problem is that as we advance to the Round of 16 there are eight different possible outcomes, Round of 8 16, etc. My question for you - how can I simplify these probabilites? I'm sorry if my question is unclear or my notation is garbage. thanks for your help
So I've got the pythagorean winning % for each team in the tourney. Using one of the Bill James Sabermetric formulas "log5" I can supposedly forecast the likelihood of one team winning over another using these #'s. The formula works out to P(A) = (A-A*B)/(A+B-(2*A*B). Right all well and good. Then I think it should follow that the Probabiity of Team A winning in the second round should be - (P(C)*((A-A*C)/(A+C-(2 *A*C)))+P(D)*((A-A*D)/(A+D-(2*A*d))))*P(A). And similarly for the other teams in the second round. My problem is that as we advance to the Round of 16 there are eight different possible outcomes, Round of 8 16, etc. My question for you - how can I simplify these probabilites? I'm sorry if my question is unclear or my notation is garbage. thanks for your help
Response by poster: Unless you know a website that is going to let me place action on the % chance one team winning will have you'd realize there is no way to profit off of this little bit of fun. Notice I didn't ask about point spreads, outright victories, anything you can actually gamble on. But thanks for being so helpful.
posted by JPD at 7:23 PM on March 13, 2006
posted by JPD at 7:23 PM on March 13, 2006
To follow b1tr0t, this is just the sort of thing that CrystalBall is made for.
It's a $1000 piece of software, but if you know anyone who works in the investment business, s/he probably can help you out.
posted by Kwantsar at 8:12 PM on March 13, 2006
It's a $1000 piece of software, but if you know anyone who works in the investment business, s/he probably can help you out.
posted by Kwantsar at 8:12 PM on March 13, 2006
There's no need for a $1,000 piece of software for this, unless you're going to be doing them all the time. This is the kind of task that scripting languages are very good at. b1tr0t nailed it for getting a useful numeric answer.
And I know it's off-topic, but jjg is wrong. I'd wager that anybody with the credentials to trade derivatives, and a deep interest in sports could create a model that would turn a profit.
The biggest blocking factors are that investment size in sports is very limited compared to the investments that are available in financial markets, and that the people with these credentials tend to be making very good money in their day jobs (working in finance, or running a sharp sportsbook).
posted by I Love Tacos at 12:53 AM on March 14, 2006
If you just want a set of win probabilities then I think Excel would be an adequate (and available) tool, both for a MC simulation or just solving from a single set of values.
I don't think there is a compact simplification for the formal problem, welcome to applied math.
posted by thrako at 5:36 AM on March 14, 2006
I don't think there is a compact simplification for the formal problem, welcome to applied math.
posted by thrako at 5:36 AM on March 14, 2006
I second Excel (or any spreadsheet). I have no idea whether your math is right, but if you can define each round in terms of values from the previous round then you can ought to be able to reuse your formulas and save yourself a lot of work.
And as for applying science to sports outcomes there's obviously plenty of benefit. Just look at baseball statistics. You can't predict the future, and you can't ensure a win, but you can set your expectations in a rational manner as well as express your historical knowledge in a very useful form.
posted by Songdog at 6:48 AM on March 14, 2006
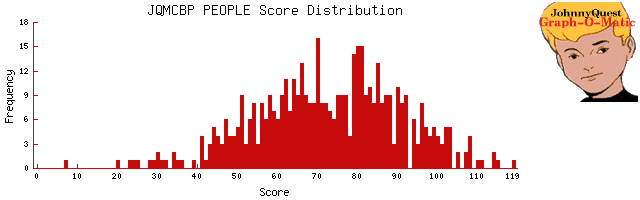
I don't know if this is helpful, but it certainly demonstrates that you aren't the only one that has been thinking about data distributions and the NCAA tournament.
From last year's NCAA tournament. Here's the distribution of scores amongst real entries to my NCAA pool (483 entries)
Here is the distribution of scores from 1000 "Chimps", generated with a random bracket selection program of my geeky design:
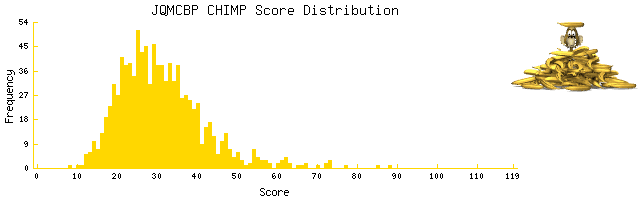
All but 1 person (who, presumably, was actually attempting to do as poorly as possible) beat at least 1 chimp, but only 80% beat all 1000 chimps.
posted by mcstayinskool at 7:26 AM on March 14, 2006
From last year's NCAA tournament. Here's the distribution of scores amongst real entries to my NCAA pool (483 entries)
Here is the distribution of scores from 1000 "Chimps", generated with a random bracket selection program of my geeky design:
All but 1 person (who, presumably, was actually attempting to do as poorly as possible) beat at least 1 chimp, but only 80% beat all 1000 chimps.
posted by mcstayinskool at 7:26 AM on March 14, 2006
Best answer: Are these the numbers you are looking for?
posted by Tallguy at 7:56 AM on March 14, 2006
posted by Tallguy at 7:56 AM on March 14, 2006
For what it's worth log5 makes no sense for the tourney, since conferences are totally different, and a tad insane.
posted by I Love Tacos at 8:34 AM on March 14, 2006
posted by I Love Tacos at 8:34 AM on March 14, 2006
Best answer: b1tr0t gives the right answer, although b1tr0t includes a layer of complexity that JPD isn't asking for -- in particular, the outer loop of the Monte Carlo algorithm isn't necessary if you simply compute the conditional probabilities deterministically rather than randomly via simulation. I think that this is what you were asking for, JPD? [Note: in a real sports book, I've no doubt that more complex methods including MCS are used].
Your problem can be broken down fairly simply.
Let's call p(a,r) the probability that team a (from the field A) wins in round r. This is what you're looking for. You can calculate p(a,r) by means of a simple recursion:
if r=1, then p(a,r) is given by the formula you used in your question. Otherwise, if r>1, then:
p(a,r) = p(a,r-1) ⋅ ( ∑ b ∈ A p(b, r-1) ⋅ p(a beats b) ⋅ ∂ (a,b,i))
The terms given here are simple:
p(a beats b) is the probability given by your formula, and ∂ (a,b,r) is an indicator function that tells you whether the bracket allows a to play b in round r (i.e. it is 1 if this is possible, 0 otherwise). [This is just to help us simplify the notation].
That's it, that's the formula. Now, a couple of things are in order. If you actually just plugged in the recursive definitions for p(a, r-1) and p(b, r-1) [for all 64 b ∈ A!] as you've done above, then, no, there's no way to simplify the resulting formula. However, you wouldn't actually do this. The recursive definition of the formula tells you the answer (again, given by b1tr0t). In particular, you will first calculate the probability for every single team winning round 1. Then you repeat the calculation for round 2 using the values you learned in round 1 (you can just plug them right into the formula) and so on. When you're done, you'll have a table with 64 ⋅ 6 values in it.
Personally, I suspect that in order to get a good answer, your probability function will need to take into account things such as style of play and injuries (at least the ones that you know at the start of the tournament, like Allen Ray's. Injuries that occur during the tournament are probably distributed randomly, possibly based on some prior such as previous injury. Thus the need for simulation). But I'm not a sports analyst so this is purely speculation on my part.
posted by alopez at 9:13 AM on March 14, 2006
Just to clarify for some of the other people reading this thread... The Pythagorean winning percentage used most often, and the ones used as the root number here are based on the numbers of the far right column of this page . These in turn are calculated from the adjusted offensive and defensive efficiency stats also on that page. Those are estimates of how often a team will score or will permit its opponent to score with 100 posessions. Although these are clearly not 100% accurate, they are some of the best predictors around for basketball. A better explanation is here.
posted by Tallguy at 12:38 PM on March 14, 2006
posted by Tallguy at 12:38 PM on March 14, 2006
The best solution is just to wait for Ken Pomeroy to post the log5 odds.
posted by mbd1mbd1 at 1:02 PM on March 15, 2006
posted by mbd1mbd1 at 1:02 PM on March 15, 2006
This thread is closed to new comments.
posted by jjg at 7:08 PM on March 13, 2006