Frequency approximation for series of events
January 21, 2012 6:23 PM Subscribe
So I want to calculate rate of events as a function of time...
Suppose I have a sequence of timestamps that mark a recurrent event:
t1, t2, t3, ... tn
And I want to approximate the instantaneous rate of events for time t, i.e., rate(t) = "events per unit time at time t"
I'm currently using a sliding window of width w centered at time t, that is,
rate(t) = (number of events e such that abs(x-e)<w/2) / w
But this is very sensitive to window size. Is there a better way?
Best answer: Fit a curve to the datapoints and take the derivative of the curve.
posted by BrashTech at 6:41 PM on January 21, 2012 [1 favorite]
posted by BrashTech at 6:41 PM on January 21, 2012 [1 favorite]
Upon further review, I defer to the physicist in the room.
posted by The Michael The at 6:48 PM on January 21, 2012
posted by The Michael The at 6:48 PM on January 21, 2012
Response by poster: Clarification: These are not (x,y) data, just a list of timestamps.
For example, suppose you work at a store and you write down the time whenever a customer walks in the door. You get a list like this:
9:06
10:13
10:21
10:40
11:01
11:05
11:17
11:19
11:22
11:28
11:37
11:56
How to plot "customers per hour" as a function of time? Averaging the whole day would give 4 customers per hour, but that's too blunt: I want a function that shows me that the arrival rate is higher at 11:30 than it is at 9:30. So maybe I should have said "frequency" instead of "rate".
posted by qxntpqbbbqxl at 7:07 PM on January 21, 2012
Response by poster: Fitting a curve and taking the inverse of the derivative might work to give me customers per hour. Hm.
posted by qxntpqbbbqxl at 7:10 PM on January 21, 2012
posted by qxntpqbbbqxl at 7:10 PM on January 21, 2012
Best answer: I think you want time-to-event math (survival analysis) but I'm tripped up by the idea of starting with an open population. If you had a closed population, you could get (x,y) data from your timestamps by calculating the proportion of your population at each timepoint that had entered the store.
posted by gingerest at 7:41 PM on January 21, 2012
posted by gingerest at 7:41 PM on January 21, 2012
Best answer: How much data do you have available?
The problem is, since you aren't working with a continuous process the true instantaneous rate is going to either be zero or one. Obviously that's not going to do you a whole lot of good if, to take your example, you need to decide how many waiters you need to have at your restaurant from 11:00 to 1:00.
Your method (a histogram vs time) or a floating mean (average amount of time between customers for customer 1 to N, 2 to N+1, 3 to N+2, etc.) would both be acceptable ways to do this.
I think you're going to have a hard time fitting an equation to this kind of data, though.
posted by Kid Charlemagne at 7:44 PM on January 21, 2012
Best answer: I think the language you're looking for is the intensity function (or cumulative intensity function) of an in- or non- homogeneous point process (often taken to be a Poisson process). One plot to make is 1/(delta time_i) vs time, since the differences should have mean 1/intensity for Poisson process. I'll think about this more tomorrow if someone doesn't chime in with something standard.
Intensity, like density, isn't observable. I usually recommend against fitting a generic curve and taking the derivative; curve-fitting need not match derivatives well. For example you can add very high-frequency low-amplitude noise to a fitted curve, fit the data just as well, and have derivatives that make no sense.
posted by a robot made out of meat at 7:44 PM on January 21, 2012 [1 favorite]
Best answer: How to plot "customers per hour" as a function of time? Averaging the whole day would give 4 customers per hour, but that's too blunt: I want a function that shows me that the arrival rate is higher at 11:30 than it is at 9:30. So maybe I should have said "frequency" instead of "rate".
I don't understand, why don't you just do a bar chart at hour increments. That would tell you how many people are in each hour bucket.
posted by empath at 8:31 PM on January 21, 2012
I don't understand, why don't you just do a bar chart at hour increments. That would tell you how many people are in each hour bucket.
posted by empath at 8:31 PM on January 21, 2012
Response by poster: Thanks for the great answers, the right terminology makes a world of difference. This gives me some good ideas to try. I'll use a numerical method for the derivatives to avoid curve fitting. Also kind of want to try a hierarchical histogram scheme (combining windows of size n, n/2, n/4, ...).
How much data do you have available?
Datasets are 10k-100k events, very bursty (flurries of activity followed by lulls).
posted by qxntpqbbbqxl at 8:31 PM on January 21, 2012
How much data do you have available?
Datasets are 10k-100k events, very bursty (flurries of activity followed by lulls).
posted by qxntpqbbbqxl at 8:31 PM on January 21, 2012
Response by poster: I don't understand, why don't you just do a bar chart at hour increments. That would tell you how many people are in each hour bucket.
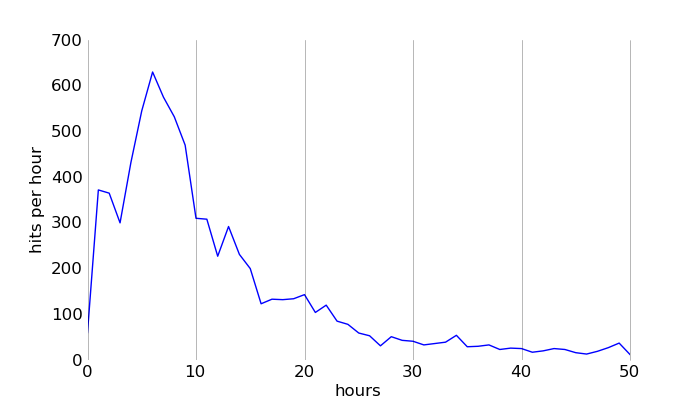
Bucketing is another option, but I need fairly high resolution (it's not actually customers in a store, but events firing in a simulation... think hits per hour).
posted by qxntpqbbbqxl at 8:37 PM on January 21, 2012
Bucketing is another option, but I need fairly high resolution (it's not actually customers in a store, but events firing in a simulation... think hits per hour).
posted by qxntpqbbbqxl at 8:37 PM on January 21, 2012
Following up, you should check out the NIST Engineering Stats Handbook--specifically, the chapter on reliability engineering (modeling a collection of events happening at random times can be cast as a problem of estimating "failure rates").
posted by scalespace at 8:47 PM on January 21, 2012
posted by scalespace at 8:47 PM on January 21, 2012
Best answer: (Fun fact: reliability engineering spawned survival analysis. Every field has a different name for it, but what's under the hood is the same.)
posted by gingerest at 8:57 PM on January 21, 2012
posted by gingerest at 8:57 PM on January 21, 2012
Best answer: You already have the answers you need (BrashTech, Kid C, and robot made out of meat), but let me suggest a simple operational method that should do the trick:
o Calculate the cumulative number of events vs time.
o Re-grid this cumulative function as a uniformly-spaced time series.
o Take the numerical derivative of this uniformly-sampled cumulative intensity function.
That's the best approximation to the instantaneous rate at any arbitrary time.
If you care only about a few specific rates, though, empath has it: bin the number of events per time interval you care about (second, hour, decade, whatever) and call it a day.
posted by RedOrGreen at 9:03 PM on January 21, 2012
I want to approximate the instantaneous rate of events for time t, i.e., rate(t) = "events per unit time at time t"
I'm currently using a sliding window of width w centered at time t, that is,
rate(t) = (number of events e such that abs(x-e)<w/2) / w
But this is very sensitive to window size. Is there a better way?
The reason this is sensitive to window size is that for discrete events, there is really no such thing as an "instantaneous" rate of events per unit time that's independent of the units you pick for time. For example, what's the "instantaneous" rate of ticks in an electric clock's second hand in events per nanosecond?
If I were you, I'd continue to use the sliding window approach, and just make the window as wide as you need it to be until the tradeoff between clustering noise and useful rate data is where you need it to be.
posted by flabdablet at 2:10 AM on January 22, 2012
You might want to read up on time series data analysis, ie Introductory Time Series with R. R might be overkill for what you are doing, you can do basic stuff in Excel.
MIT has an opencourseware course in Time Series but again that could be overkill. See also Introduction to Time Series Analysis from NIST, and here is a blog post that wraps up some videos & presentations on time series data.
posted by lyra4 at 5:06 AM on January 22, 2012 [1 favorite]
MIT has an opencourseware course in Time Series but again that could be overkill. See also Introduction to Time Series Analysis from NIST, and here is a blog post that wraps up some videos & presentations on time series data.
posted by lyra4 at 5:06 AM on January 22, 2012 [1 favorite]
There are going to be lots of ways to measure this, and none is assumption-free. It strikes me that the most comparable measurement that gets made often is measuring the firing rate of spiking neurons. One gets a list of spike times (your customer time stamps) and wants to know the instantaneous number of spikes per unit time. There are a few ways to do this, but all of them require assuming some sort of time scale. What I would suggest is to figure out what a relevant time scale is for your data; Does it matter if someone comes at 5:10 versus 5:12? If not, then maybe 2 minutes isn't a good time scale to care about. Then I'd bin (or use a gaussian kernel) to those values. If you have 10^4-10^5 events, the noise is going to be little enough that almost any technique should work.
First pass suggestion: Bin all of your data into non-overlapping 10/15/20/30/60 minute intervals. For each interval, generate a box plot to get a sense for both means and the variance of the distribution. Then pick whatever time scale gives you the most clean presentation of information. Unless you're asked to quantify exact statistical significance or to understand multi-time-point correlations (i.e. if less than average numbers of people show up between 3-3:30, more than average will show up between 4-4:30), almost any technique should tell you fairly similar information. Might as well pick the approach that is simplest to calculate and understand.
posted by Schismatic at 5:59 AM on January 22, 2012 [2 favorites]
This thread is closed to new comments.
posted by The Michael The at 6:39 PM on January 21, 2012