Building a sculpture of a sound
January 18, 2010 2:48 PM Subscribe
How can I turn a waveform graph of an audio clip into a string of numbers describing the graph?
I want to build a 3D representation of a five(ish) second audio clip. My plan for this is basically:
1) Record the clip
2) Put audio into Audacity and do a screen capture to get a picture of the waveform
3) Chop the graph into about 150 vertical slices (i.e. vertical lines spaced along the Time axis)
4) Determine the height of the waveform in each slice (mean, maximum, mode - whichever I think looks nicer)
5) Use the measured height of each slice to build a physical slice (basically, cut a disk to that radius) then assemble them in order to give a physical model of the waveform
My sticking point is with steps 3-4. Obviously I could do this manually with a printout or with the rulers in a graphics program, but I didn't buy a computer so I could do precisely defined, repetitive analysis tasks by hand!
So, can you suggest a way to automate this process? Basically to look at an image, determine where the top of a graph is along an x-axis (move one pixel along x axis, count how many pixels upwards the green region goes, repeat) and send that to a file?
I realise that I'm turning numbers in a .wav file to a picture then back into numbers... if there's a way to get the same result by analysing the audio clip directly instead of the picture, that'd be grand. Can I script an audio program to report the amplitude at time x?
I can run software on Linux (openSuse) or Windows XP. I don't have any programming skills to speak of but I'm interested in learning, so pointers to useful commands (checking pixel colours in a picture, amplitude in a sound file, etc) in fairly easy languages (Python?) would be appreciated too.
This is for a sculpture so, while my geekiness wants perfect representation of the information, I'm already throwing away a huge amount to cut five seconds down to 100-200 slices. So I'm happy to make some concessions to form over function; the data I get out can be a bit dirty and "close enough", but of course more accurate would be more satisfying.
Best answer:
will convert your sound file to any easily-parseable stream of numbers.
posted by scruss at 5:54 PM on January 18, 2010
sox infile.wav outfile.datwill convert your sound file to any easily-parseable stream of numbers.
posted by scruss at 5:54 PM on January 18, 2010
You might check out libsndfile. http://www.mega-nerd.com/libsndfile/ will read your audio file into memory... and then you have your numbers, already.
Taking a screen show of an audacity rendering and then converting *that* into numbers... that's crazy talk.
posted by smcameron at 6:14 PM on January 18, 2010
Taking a screen show of an audacity rendering and then converting *that* into numbers... that's crazy talk.
posted by smcameron at 6:14 PM on January 18, 2010
Sox will convert to a flat 16-bit file (RAW) for you, but a 16-bit WAV is raw data anyway with a header that you can just skip. If you can't be bothered using sox and don't need to be precise, take your WAV file, chop about 1kB off the front and treat it as an array of 16-bit samples. If stereo, you get an L sample then an R sample.
If you want one value in your graph say per 50ms, the simplest approach is to decimate the signal, i.e. throw most of it out. One per 50ms is 20Hz and with a file sample rate of 44100Hz (from a CD), you keep 20/44100=1 in 2205 samples. If it's a stereo input, keep 1 in 4410. If you don't want aliasing effects, filter the sound beforehand to have nothing above half the rate you're decimating to (so 10Hz lowpass in this case, which will give practically no signal).
A better approach than decimation is to measure the power (or RMS level) of each 4410-sample sequence instead of throwing them out. That gives you a sort of general loudness indication without frequency dependence, so it won't matter how much you decimate by.
Analyzing images captured from a WAV editor is utter madness. Just read the damn audio file directly, it's a very simple file, much simpler than any image file you might read.
posted by polyglot at 10:48 PM on January 18, 2010
Sorry, I missed the "no programming" bit. You could do this in a spreadsheet if you convert the samples to ASCII numbers (short sounds at low sample rates preferable so as not to overwhelm the spreadsheet app). PM me if you'd like me to write a couple lines of Perl to do that for you. It's about 3 more lines of Perl to do the RMS+decimation.
posted by polyglot at 10:51 PM on January 18, 2010
posted by polyglot at 10:51 PM on January 18, 2010
Oh yeah, the unix utility "od" can do the conversion from RAW to text for you. Tell it to print your file out as 16-bit signed numbers (8-bit unsigned if it's an 8-bit WAV) and feed that text into a spreadsheet.
posted by polyglot at 10:56 PM on January 18, 2010
posted by polyglot at 10:56 PM on January 18, 2010
Best answer: What you're doing is really just resampling the clip from 44.1kHz down to about 30Hz. If you're using sox you can just use that to do the resampling, e.g. -r 30.
posted by Rhomboid at 7:00 AM on January 19, 2010
posted by Rhomboid at 7:00 AM on January 19, 2010
Using Audacity's waveform graph as an intermediate step between the audio and your own graph seems like an unnecessary and difficult extra step. Just downsample the audio (a lot, since you want only 150 samples) and the resulting numbers are the ones you need.
I don't think you can do this without any programming, but it could take very little programming. I don't know about NumPy, but if you have Matlab, you could load the audio file using the wavread function (use Audacity to save it as WAV first). This gives you an array of numbers representing all the samples in the audio (probably 44000 of them per second). You can reduce this to 150 samples dividing the array into 150 chunks and averaging the numbers in those chunks together, or whatever you like.
posted by k. at 8:49 AM on January 19, 2010
Also, maybe you already know this, or it's not what you want to hear, but: if you take only 150 samples of your signal, it may not look like much. The height of the waveform on such a large scale just represents the overall loudness of the sound. If the sound doesn't vary much in loudness, the result is not going to look very interesting. You know how the waveform looks in Audacity when you're zoomed all the way out? It's going to look like that.
posted by k. at 9:00 AM on January 19, 2010
posted by k. at 9:00 AM on January 19, 2010
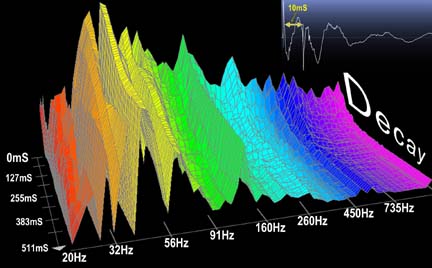
Best answer: I know this question is not about the artistic aspect of your sculpture, but have you considered ways of representing the audio other than just the raw waveform? There are many, many things you can do to a sound to produce an interesting graph. You could even use a multi-dimensional representation that would give you a 2D surface if you computed it for many short segments of the sound and stuck all the segments together. For a start, you could take the Fourier transform of the sound over 150 .03-second segments...just be there are a lot of choices.
posted by k. at 9:13 AM on January 19, 2010
posted by k. at 9:13 AM on January 19, 2010
Best answer: I thought k had a good point about a 30Hz version of your audio not looking like much and considered chiming in my nay-saying, but then I tried it out and it looks great. It'll depend on what your audio is like though. Mine was the first five seconds of Underworld's "Push Upstairs", which is pretty thumpy and you'd expect to see something interesting even at this low frequency.
For some reason, sox didn't want to downsample the rate by such a big factor, so I had to do it in three steps. Anyway, the following command should get you what you want if you don't need to control how the downsampling is done:
sox /tmp/input.wav -c 1 -r 3000 -t wav | sox -t wav - -r 300 -t wav - | sox -t wav - -r 30 -t dat - | tail -n +2 | awk '{print $2}'
You'll want to rescale the numbers (say, in a spreadsheet, which could also plot them for you), and a few of mine appear to be in scientific notation (which, if it's just a few, you could probably deal with by hand).
Send me a photo after you build it. :)
posted by aigeek at 1:32 AM on January 20, 2010
Response by poster: Wow, thanks for such great answers. I will definitely look at the sound file directly now you've pointed out great ways to manipulate it; I'll have a look at sox and the python tools to see whether I can pick them up fairly easily.
k - thanks for the suggestion about looking for other transforms of the data. Representing the waveform was my first thought, simply because I don't really know anything about the more sophisticated representations. Something like this could also be great, perhaps with time, amplitude and frequency as x, y and z respectively. I might save that for version 2 though, as I have a lot to learn about how sound is represented and analysed.
aigeek - thanks for taking the time to write out a specific command! I'm not at my linux box at the moment, but I'll be sure to try it and fiddle around a bit when I have a chance.
I hope to have a version built by early February; I'll be happy to send a photo to anyone who wants to see it. Be warned that I don't have much experience building stuff, so it could be an anticlimax!
posted by metaBugs at 12:07 PM on January 20, 2010
I would love to see what the sculpture looks like when it's done, and I bet other people would too. Maybe you could post a picture on MeFi Projects.
posted by k. at 7:31 PM on January 20, 2010
posted by k. at 7:31 PM on January 20, 2010
Post it to this thread too if you can. It's always nice to have the whole story in one place.
posted by aigeek at 4:44 PM on January 21, 2010
posted by aigeek at 4:44 PM on January 21, 2010
You could easily feed this output into a Rapid Prototyping machine to make smaller versions quickly.
posted by gallagho at 6:19 AM on April 26, 2010
posted by gallagho at 6:19 AM on April 26, 2010
This thread is closed to new comments.
Once you have it in an array, it should be straightforward to divide the array's length into a few hundred ranges and find the maximum / mode / total energy / whatever in each slice.
posted by hattifattener at 3:04 PM on January 18, 2010